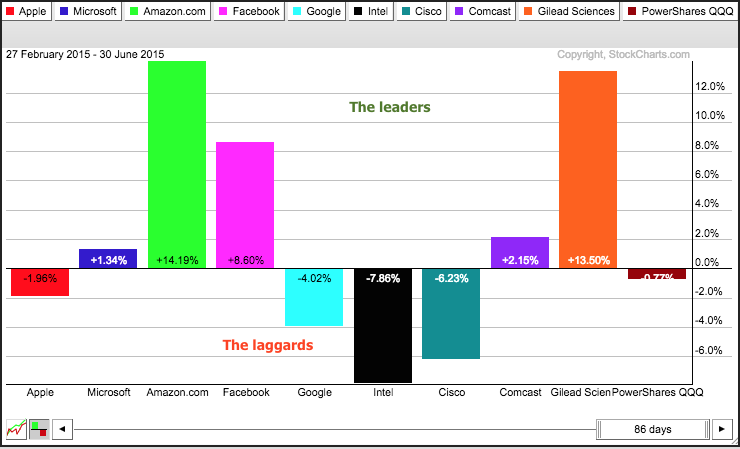
A look at performance for the top holdings in the Nasdaq 100 ETF (QQQ) explains a lot about performance since March. The PerfChart below shows the percentage change for QQQ and its top nine holdings. Note that this chart does not include Wednesday's price data, which is still subject to change. Over the past four months, QQQ is down around 2%, four stocks are down and five are up. Note that Apple, which is by far the biggest holding, is down and should probably count twice. Using this funny accounting, five are up and five are down, which makes for a draw. I will show two CandleGlance charts with these stocks after the jump.
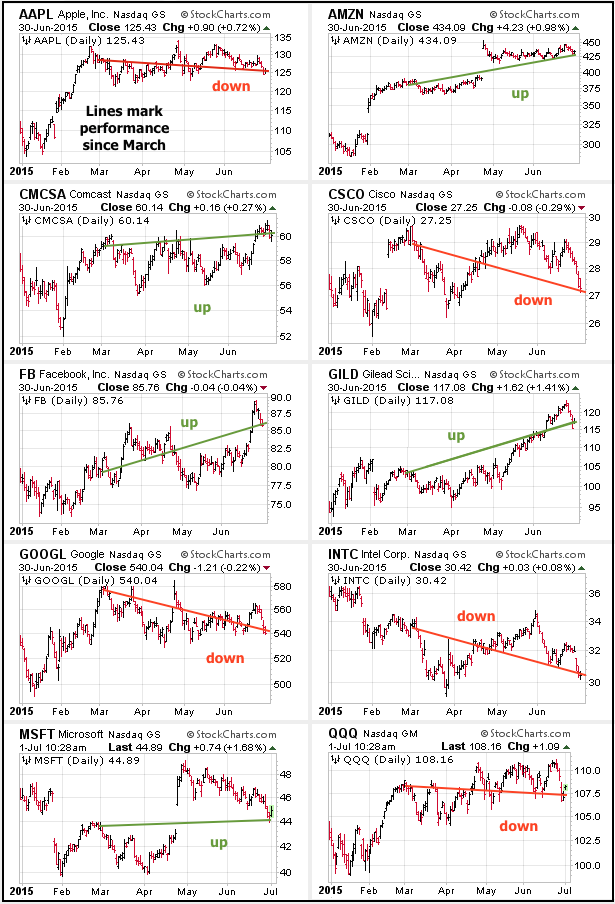
The first CandleGlance chart shows lines extending from March 1st to June 30th to define the general trajectory. This is just a reflection of the PerfChart. Five are up during this period, four are down and QQQ is down. This split is why QQQ has nothing to show for four months of trading. Note: The image with the charts is a screen-shot. The lines and notes were added using MS Paint.
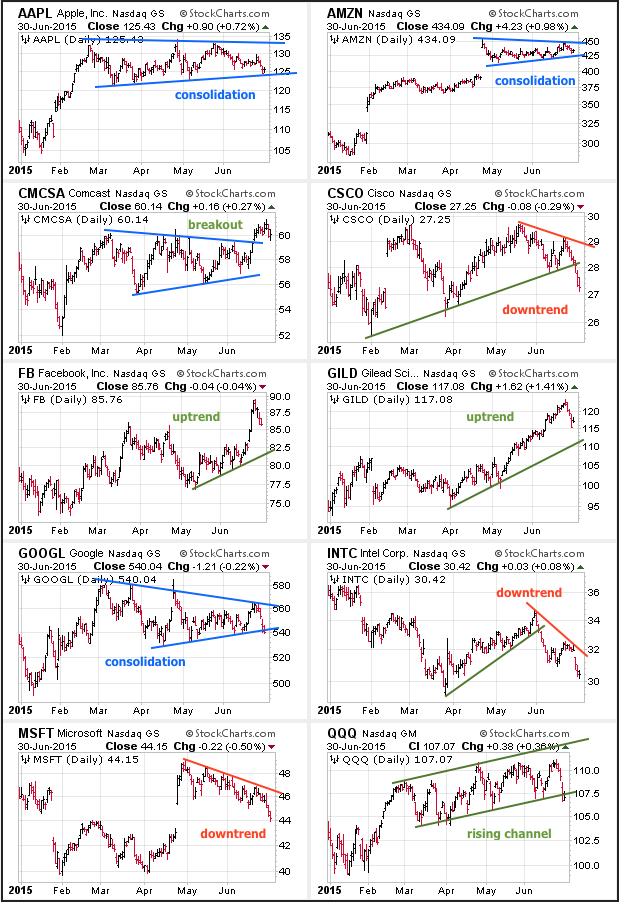
But what about the chart patterns at work? Facebook (FB) and Gilead (GILD) are in clear uptrends and Comcast (CMCSA) recently broke out to new highs. These stocks are the strongest and the leaders. Cisco (CSCO), Intel (INTC) and Microsoft (MSFT) are in clear downtrends right now. These are the laggards. Apple (AAPL), Amazon (AMZN) and Google (GOOGL) are in consolidation patterns and could tip the balance. Apple is at support, the range is narrowing on Amazon, and Google is on the verge of a break down. Notice that QQQ is testing the lower trend line of a rising channel and this is a make-or-break point. QQQ can bounce as long as Apple and Amazon hold support and bounce, and Google holds 540. Break downs by these three would tilt the balance towards the bears for QQQ. Note: The image with the charts is a screen-shot. The lines and notes were added using MS Paint.
Click this image for a live chart
