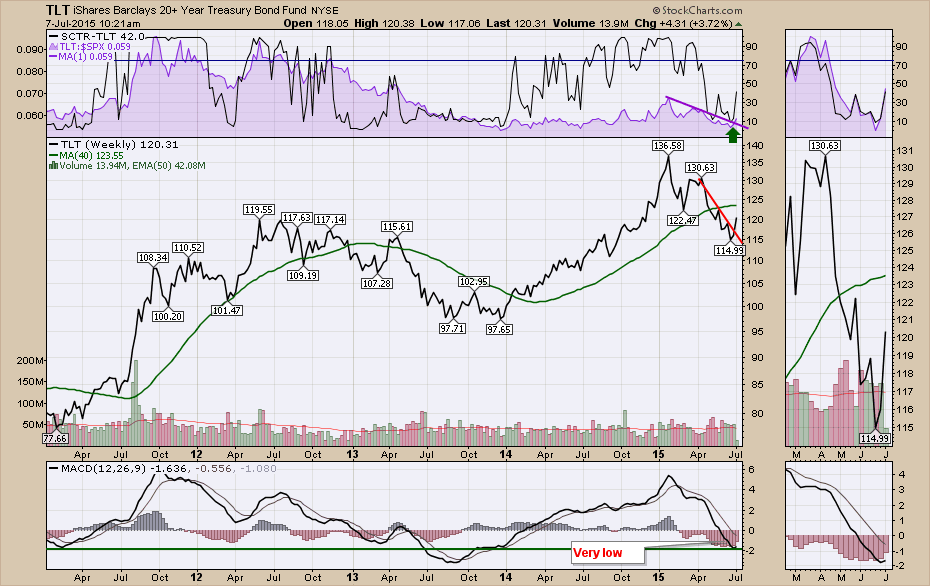
The news in Greece has turned a few charts. The news from China is equally newsworthy. The chart of the TLT is one of the most sensitive as it potentially shows investors looking for safety in US treasuries. We can see the 6 month thrust from January to June was down, but this morning has taken out the prior weekly high.
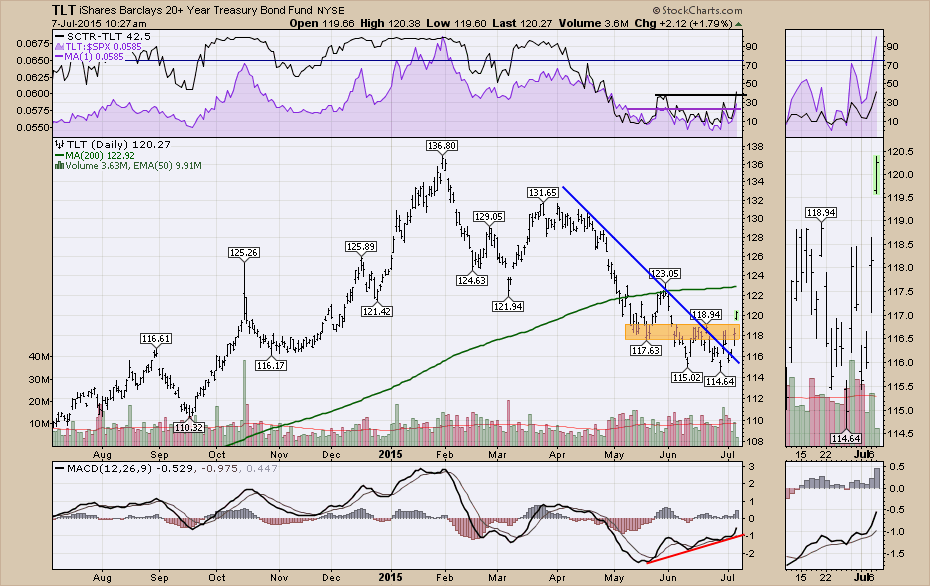
On the daily, the information is a little easier to see. There is a nice positive divergence setting up on the MACD. The Relative Strength has moved above the prior high and so has the SCTR. This morning we made new one month highs which is the first step for a directional change.
If bonds are reversing, this has implications across the market. I will cover the Bond markets on Thursday's webinar.
Good trading,
Greg Schnell, CMT
