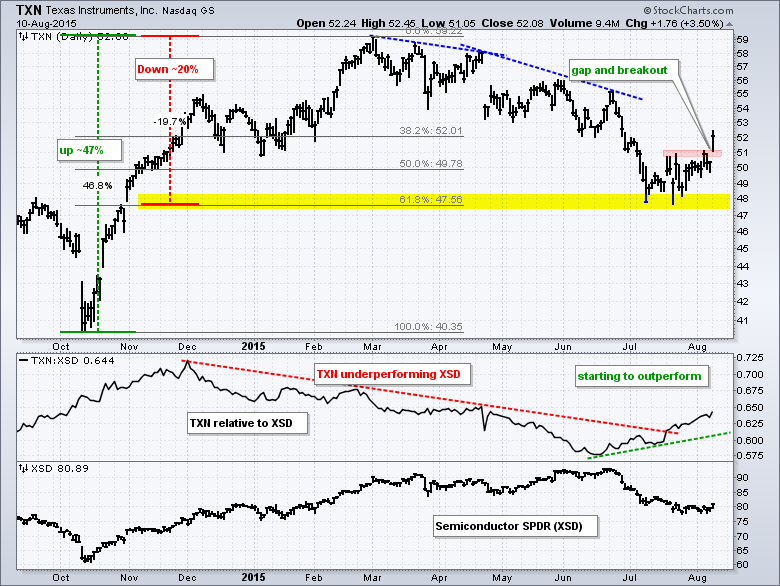
The Semiconductor SPDR (XSD) has been one of the weakest industry group ETFs within the technology sector over the last two months, and Texas Instruments (TXN) has been one of the weakest stocks in the group. That might be changing. The middle window on the chart below shows TXN relative to XSD using the price relative (TXN:XSD ratio). This ratio peaked at the beginning of December and fell until the middle of June as TXN underperformed. The ratio turned up over the last two months as TXN firmed and started outperforming XSD. Turning back to the price chart, note that TXN firmed in the 48 area twice in July and this area marks a 62% retracement of the October-March advance. The stock then broke resistance at 51 with a gap and this looks like a breakaway gap. The gap zone turns first support in the 50-51 area. A strong gap should hold so a break back below 50 would negate the breakout.
 Click this image for a live chart
