Best wishes to all of our American readers on this historic date in history. My heartfelt thoughts and best wishes go out to all of you.
Charts can fool you when you look at a chart like Priceline (PCLN). Everything looks normal until you look at the scale on the right and see that the swings are hundreds of dollars / month. Talk about a well travelled roller coaster! Let's look at the chart here as it has many of the traits of a bullish stock except one.
The SCTR has soared above 90. Performing better than 90 % of the large cap stocks is an outstanding metric for a $65 B market cap stock like Priceline. That is very bullish and the stock has taken off from the August lows and is $100 higher already. The Relative Strength shown in purple is clearly outperforming and just made 1 year highs! That is extremely bullish. Price is at a major resistance level on the chart right now. The volume on the move up has been below average almost every day which is not a bullish sign when powering out of the August lows.
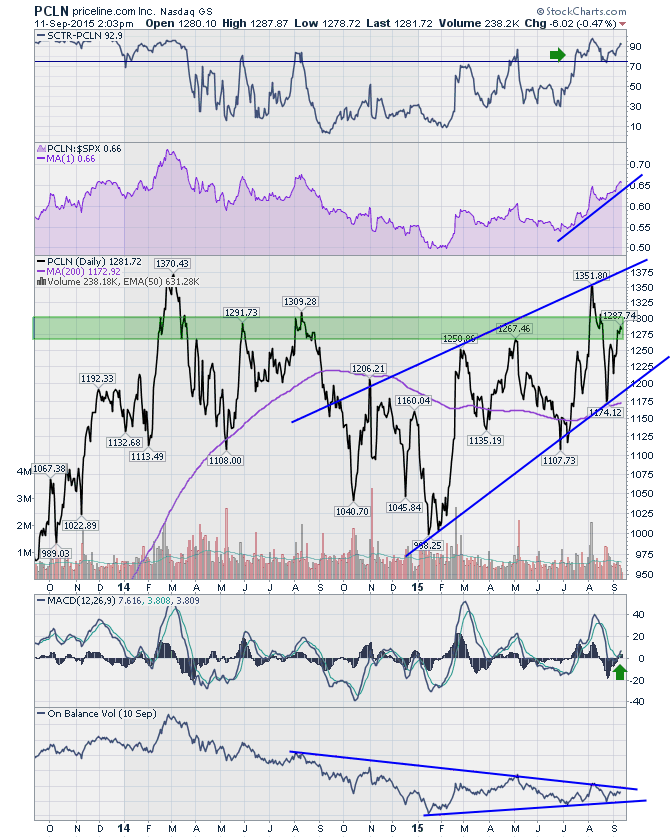
One of the last two indicators is the MACD which I left on the chart for consistency. You can see the MACD has just made a bullish cross but this MACD is not that helpful in assessing trend due to the volatile nature of the stock. The real holdup on this stock for me is the On Balance Volume is at levels it was at in January but the price is $200 higher now. PCLN can climb with flat OBV as you can see but I have drawn a pennant formation here with lower highs and higher lows. A breakout either way should be respected in light of the low volume on this advance. A positive break would be bullish, but investors may wish to protect themselves should this OBV start making lower lows.
Have a good weekend!
Good trading,
Greg Schnell, CMT
