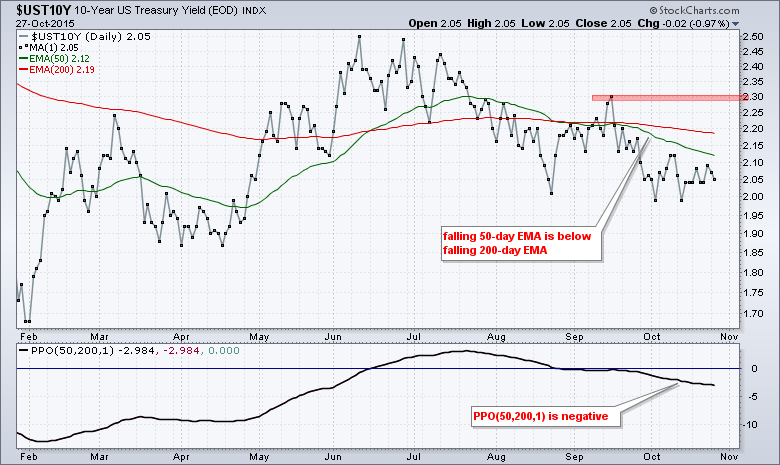
Treasury yields are in a clear downtrend since June, but a small anomaly is taking shape because the 30-year Treasury Yield ($UST30Y) did not confirm the lower low in the 10-year Treasury Yield ($UST10Y). The first chart shows the 10-yr yield peaking around 2.5% and falling towards the 2% area in October. Actually, the yield hit the 2% area in late August and then edged below the August low in October. The trend here is clearly down with the 50-day EMA below the falling 200-day EMA. Also notice that the PPO(50,200,1) is negative. As the percentage difference between two EMAs, a negative PPO indicates that the shorter EMA (50-day) is below the longer EMA (200-day). At this stage, a move above 2.3% and a golden EMA cross are needed to reverse this downtrend.
The next chart shows the 30-year Treasury Yield ($UST30Y) in a downtrend, but this downtrend is less pronounced and the 50-day EMA is still very close to the 200-day EMA. Also notice that the 30-yr yield held well above the August low. It is interesting to see the longer yield holding up better than the shorter yield. Nevertheless, the overall trend is still down and I have yet to see anything that would warrant a reassessment.
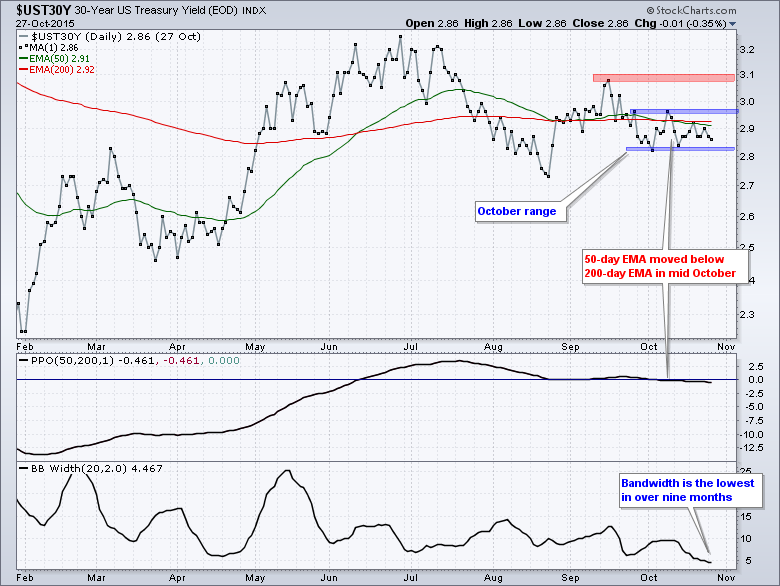
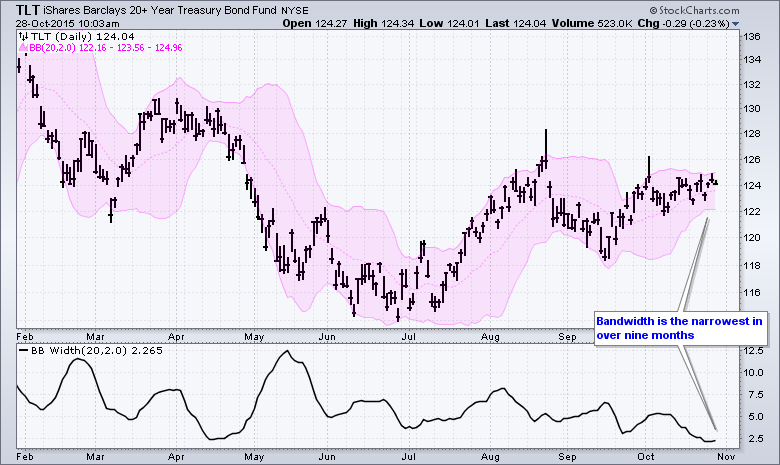
Here's what to watch. The 30-yield has fluctuated in a narrow range the last four weeks and this means we are seeing a volatility contraction in the bond market (long end of the curve). Just to confirm this, I added Bollinger BandWidth as an indicator and it is at its lowest level in over 9 months. John Bollinger theorized that a volatility contraction often leads to a volatility expansion and this means we should expect some movement soon. Hey, whaddayaknow! We have a Fed meeting this week. Chartists can watch the October range for the first direction break to foreshadow the direction of the next move. An upside breakout in yields would be bearish for the 20+ YR T-Bond ETF (TLT), while a downside break in yields would be bullish for TLT.
****************************************
Thanks for tuning in and have a good day!
--Arthur Hill CMT
Plan your Trade and Trade your Plan
*****************************************
