It has been a phenomenal run for Sherwin-Williams Co. (SHW). The 10-year chart has been a massive acceleration from bottom left to top right. Here is a link to the long chart. SHW 10 Year. Recently someone spilled a can of paint as the stock tumbled 25 % in a few months. Now a plummeting stock price is always worrisome, but recently SHW started to climb back. Thursday's candle jumped up and now the stock is apparently painting the profit picture green once again. With the MACD back above zero, a rising SCTR moving above 50, a historical track record of rising profits and rising stock prices, what is not to like? In the past 10 years, there have only been 4 pullbacks below the 40 WMA. Briefly in 2006, the Financial Crisis of 2007-2009, the pullback on European debt woes in 2011 and the plunge of 2015. If the bull market can continue, this stock has been a pretty good follower of major trends. With the trend in Relative Strength breaking to the upside, as well as making one-month highs, the entry looks intriguing.
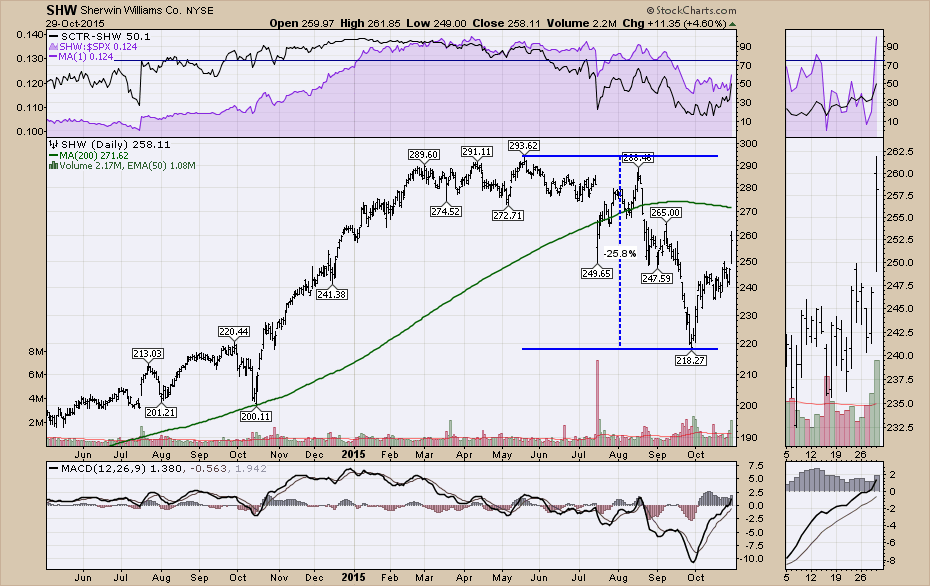
If Thursday's low does not hold, that would be a reasonable exit as this stock has a lot of supporters and something must be changing if big moves like this become false breakouts. Watching for resistance at the 200 DMA would also be important for me. Poor price action should be respected if the stock can not break through the long-term average. Long down trends usually start by failing to get back above the 200 DMA. You never know when the big trend is over until we can see it in the historical chart context. Perhaps this just pulled back on weakness in the industrial complex. Perhaps a more sinister condition like their environmental paint systems are starting to mature in the market is showing up. I like it here, but my loyalty to ownership would fade if either of the two conditions started to show up in the stock price action.
Good trading,
Greg Schnell, CMT
