The Hong Kong tracking ETF (EWH) has been immersed in a downtrend for a while. It moved above a 7-month trend line on Wednesday which makes it a very interesting candidate for review. The EWH also moved above a support/resistance line around $19.90. There is also an important support /resistance zone at $21.50. I have shown that zone with very subtle dots so that chart does not look so busy. The last piece of information that is positive is the MACD has made a much higher low in momentum and could push above zero in the next few days.
However, one of the major concerns on the chart is the down sloping 200 DMA. This moving average is not encouraging as a down sloping long-term 200 DMA has to be interpreted as bearish. It recently rolled over in August. Secondly, the relative strength is shown in purple and is not making higher highs nor has it broken the purple trend line. Lastly, the SCTR ranking is still very low at 35.
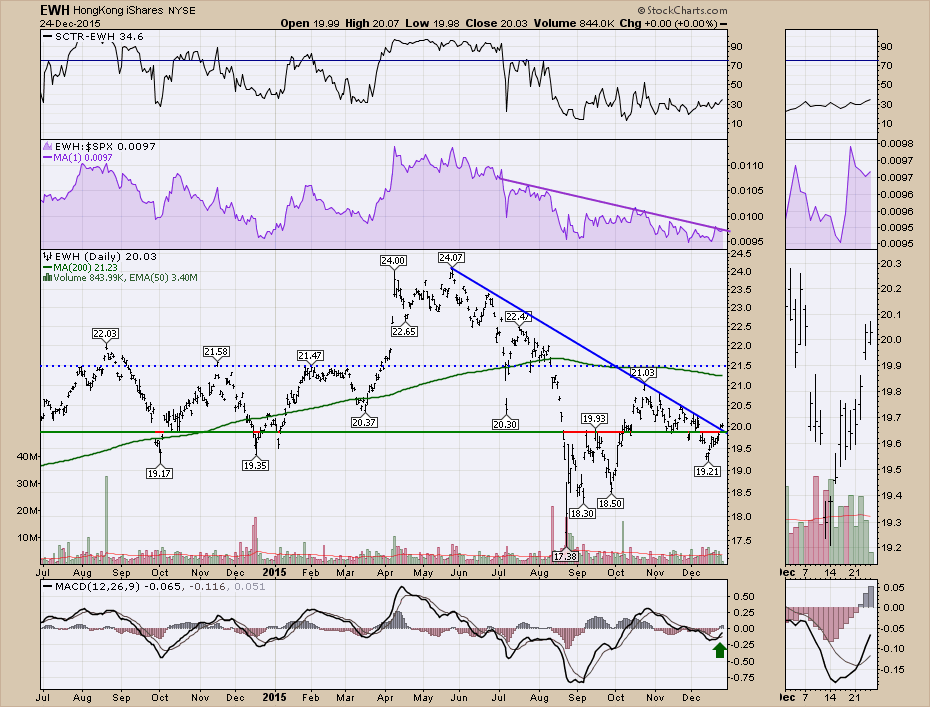
The bounce above the horizontal support/resistance and the down sloping trend line are bullish. As long as the EWH holds above the support line it looks ok. The chart has a lot of work to do to get very bullish, but the same could be said for almost all the country ETF's. Perhaps this break above the trendline is the start of a major trend for 2016.
Good trading,
Greg Schnell
