CA Inc (CA) topped in March 2015 and was in the midst of an 8 month downtrend - until last week's action. Prior to the break of this downtrend and key 20 week EMA resistance, CA had printed a fresh weekly CLOSING low that was accompanied by a higher MACD, a classic positive divergence. It wasn't easy to see the positive divergence, especially if you use candlesticks as I do. Remember that the MACD uses CLOSING prices, not opens or intraweek lows. One glance at a candlestick chart won't always reveal that positive divergence. That's when a simple line chart has an advantage because the line only connects closing prices. It eliminates all the other noise on the chart. Take a look at the chart of CA below as a perfect illustration:
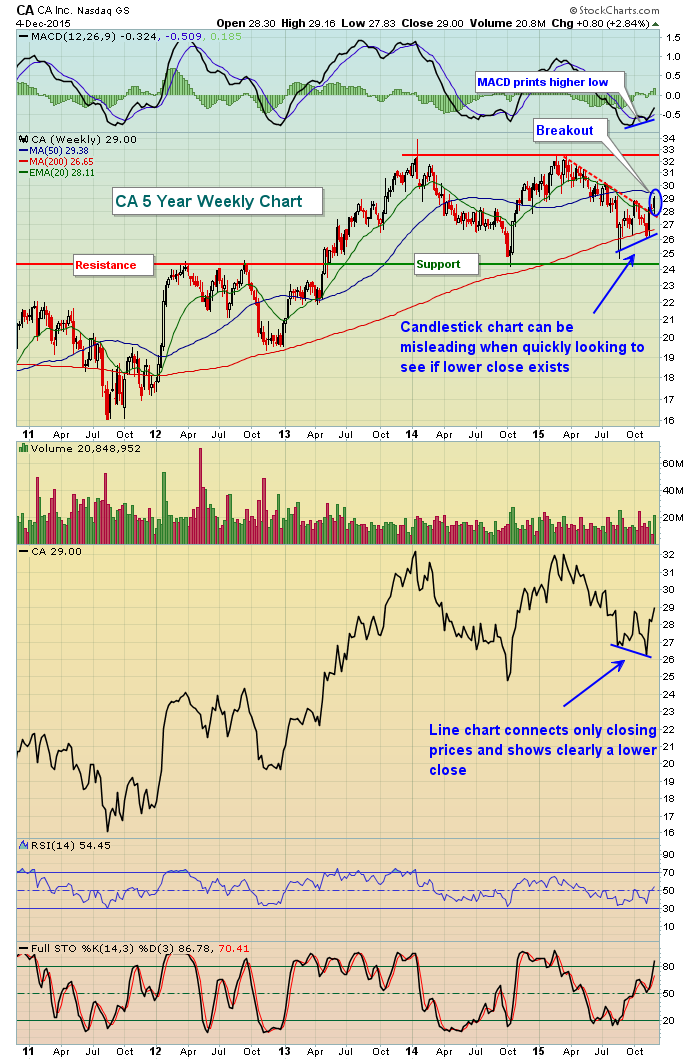
I rarely use line charts, but spotting positive and negative divergences is much easier using line charts over just about any other chart form. The positive divergence suggested that momentum to the downside was slowing and CA is in the midst of a longer-term uptrend. Last week's breakout above 8 month trendline resistance indicates the probability of higher prices ahead.
Happy trading!
Tom
