If you've ever used the Chaikin Money Flow (CMF) or Accumulation/Distribution (AD) as indicators to help gauge buying and selling pressure, just make a note that gaps to both the upside and downside are ignored in their calculations. Let's take the NASDAQ Composite as an example. Since the end of the year, it would be difficult to argue that the action has been bullish, yet we've seen the CMF and AD rise. The CMF shows a bullish crossover from negative territory into positive. Chartists use such crossovers to help confirm a shift from bearish to bullish. Take a look at the NASDAQ chart below for the past six months:
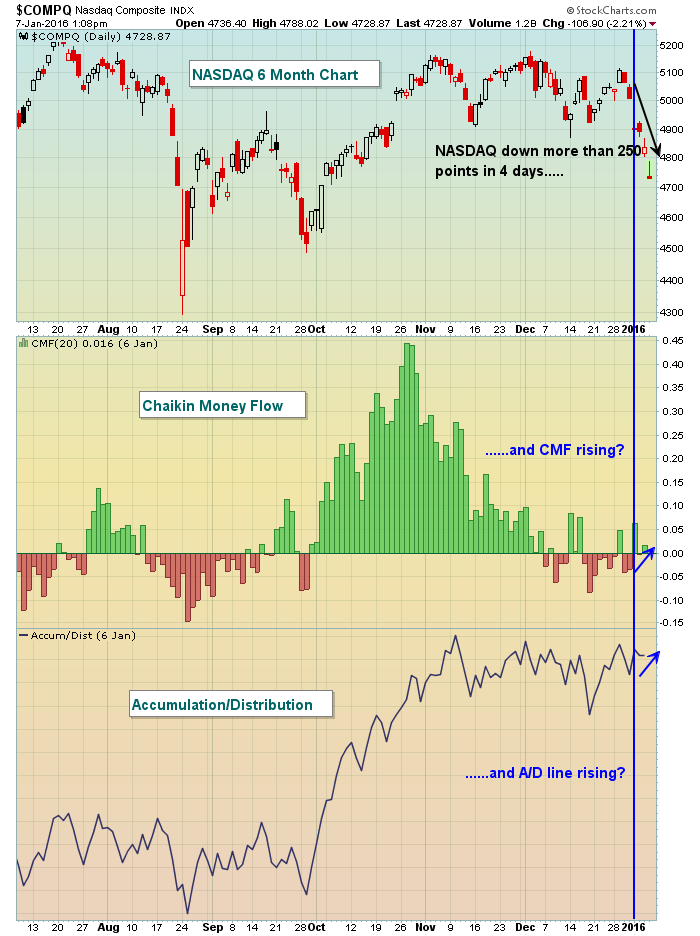
How could this index fall precipitously for four days and both the CMF and A/D lines turn more bullish? Well, both of these indicators were developed by Marc Chaikin, but they share one common trait. Neither of these indicators considers the prior day's close. Most of the losses experienced thus far this year have occurred at the opening bell with three significant gap downs in the first four trading days of the year. Both the CMF and A/D line calculations are based on highs, lows and current closes (as opposed to prior closes). Therefore, if we see the NASDAQ finish a day nearer its high of the day than its low of the day, both CMF and A/D lines will treat such action bullishly and rise.
There are a couple of superb articles in the Chart School on both of these indicators. If you use them, you should read these articles to make sure you understand how these indicators work.....and sometimes why they don't. Here are the links:
Accumulation/Distribution Line
Happy trading!
Tom
