All of us old enough to remember John Wayne as the actor in the Hellfighters movie based on Red Adair's career of extinguishing blowouts might add some bourbon in their coffee this morning. It would appear in the short term that the blowout in the price of oil might have limited the spillage at $27.56 on a $WTIC chart for the time being.
The chart below is the oil tracking ETF, (USO), which gives us an intraday view of the spot price. Today it made a higher high on the daily chart above the $9.29 level. Usually, commodities like to test their lows, so I wouldn't be surprised that we have to make at least one more rollover in the next 6 months to test this low. Whether the January 20th, 2016 low holds is another question.
Currently, the relative strength line has broken the downtrend, which is a first step in stabilizing the price. When oil continues to underperform the market, there are not many investors that want to enter a position.
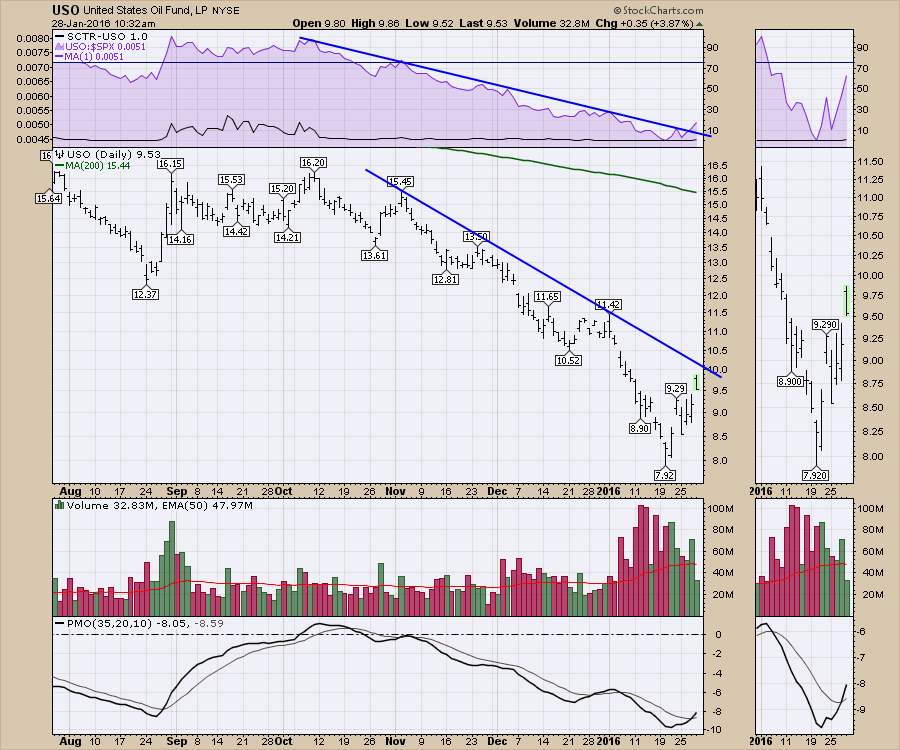
The price could rise 60% and still be below today's 200 DMA reading! That is a lot of room. The down-sloping trendline shows the first resistance overhead. Above that, the gap at $10.50, the high at $11.42, and the gap at $12.00 - $12.50 are all meaningful targets.
The huge volume swell suggests some level of a blowout. It will take a few months before its under control, so this will still be swinging wildly until some stability between supply and demand is found.
For investing in the oil companies, please remember that they will be announcing their reserves in the upcoming months. In some cases, the corporate assets will be written down dramatically. Caution is warranted owning the companies until this reserves calculation is published for shareholders. Only the reservoirs where the oil can be pumped profitably at a calculated price which is definitely below $50 can be included. Whether they use the futures curve, the spot price, the 12-month historical average, or a blend of these, the numbers are at very low levels. Because the companies have to use independent appraisers, this is not a flexible situation. There are different ways to calculate the reserves, but some companies may have most of their reservoirs unprofitable. When the book value of the reserves plummets, the debt load the company carries becomes too high. They need to sell shares to raise money or struggle to avoid bankruptcy. Both of these outcomes are brutal at the current price of oil as the company shares have dropped in value.
While the higher high this morning is nice to see, it is a trading environment for the near future. I will be discussing oil stocks and oil in the Commodities Countdown webinar this afternoon at 5 EST. Click on this link to register. Commodities Countdown 20160128.
Good trading,
Greg Schnell, CMT
