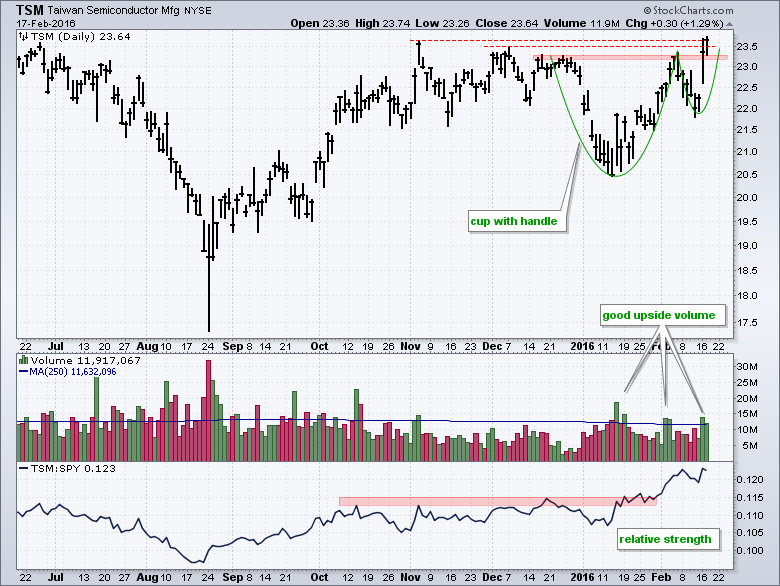
Taiwan Semiconductor is breaking out of a bullish pattern with good volume and the stock is showing relative strength. The price chart shows a cup-with-handle forming from December to mid-February. This is a bullish continuation pattern that was popularized by William O'Neil. There are three resistance levels marked with the recent highs and the stock is on the verge of breaking the third. A breakout would signal a continuation of the advance from mid-January to mid-February. The first indicator window shows upside volume (green) outpacing downside volume (red) over the past month. This shows strong buying pressure. The bottom window shows the price relative in an uptrend with a new high in February. This means TSM is outperforming SPY and showing relative strength. Overall, there are at least three bullish forces at work on this chart and this favors higher prices.
 ****************************************
Thanks for tuning in and have a good day!
--Arthur Hill CMT
Plan your Trade and Trade your Plan
*****************************************
