It was a rough January for stocks, but CBS held up quite well and shows a bullish looking chart. On the price chart, CBS sports a classic surge-correct-breakout sequence. First, the stock advanced over 20% with a move from ~39 to ~52. Second, the stock corrected by retracing around 62% of this advance. This correction appears to be ending as the CBS formed a big hammer and followed through on this hammer with further strength.
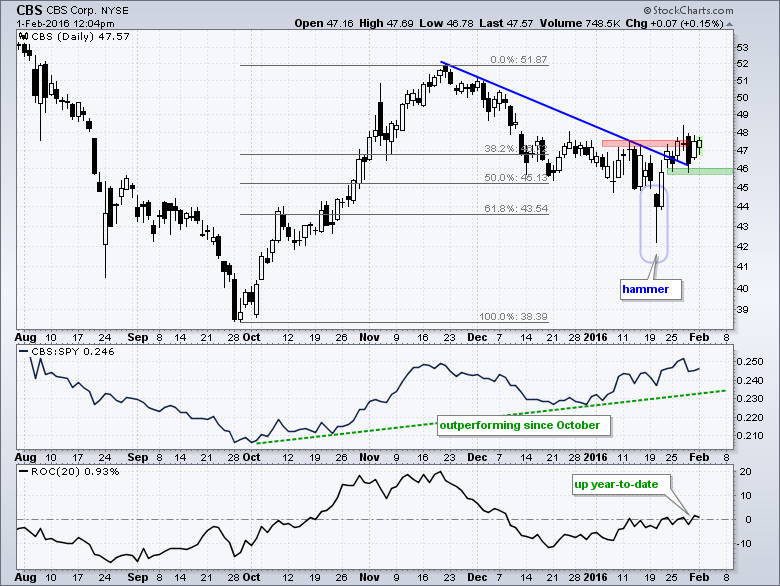
The stock also shows relative strength since October and in January. The first indicator window shows the price relative (CBS:SPY ratio) forming a higher low and exceeding its mid November high last week. This uptrend in the price relative means CBS is outperforming SPY. The bottom window shows the 20-period Rate-of-Change, which covers the year-to-date period. SPY is down around 5% during this period and CBS is up a fraction.
Even though the chart here looks promising for further gains, keep in mind that the broader market (S&P 500) is in a long-term downtrend. Also note that CBS reports earnings on February 11th and this adds a little more uncertainty next week.
****************************************
Thanks for tuning in and have a good day!
--Arthur Hill CMT
Plan your Trade and Trade your Plan
*****************************************
