It's difficult to argue that Apple has been one of the best performing stocks - if not the best - in the 21st century. But every stock has its limitations and a good question is whether AAPL has reached its top. AAPL has fallen 30% from its peak in May 2015. So was that the top? Well, betting against AAPL this century has been a losing proposition as it closed at just 3.40 on December 31, 1999. It's currently up 30-fold and that's AFTER a 30% 9 month haircut. Technically, AAPL appears to be a major support level, however, as reflected on the following chart:
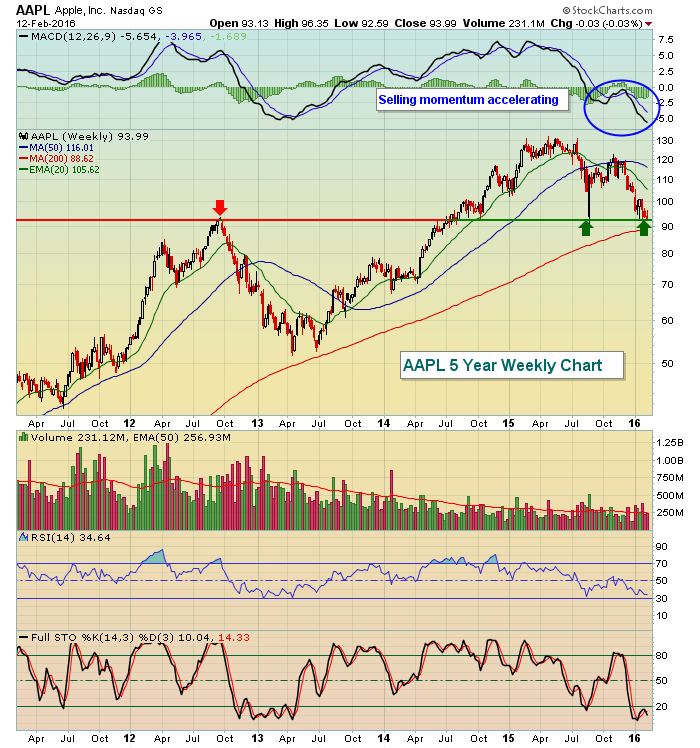 I'm not one who likes to bet against AAPL, but the technical conditions are not good. Selling momentum is accelerating and major support is being tested. Volume hasn't been particularly heavy, though, so perhaps the bulls can hold the 90-93 support area and resume the long-term uptrend. Beware a heavy volume break below 90 as that could send shockwaves into technology stocks.
Happy trading!
Tom
