Wal-Mart (WMT) based for more than a decade beginning in 2000 before it finally made a significant technical breakout in 2012. WMT then nearly tripled over the next three years before stumbling over the past year. Perhaps the biggest question is whether the selling has ended and WMT is now poised to move higher. Well, the weakness we saw in 2015 was important because the low that was reached actually tested the breakout a few years earlier and also tested its rising trendline. Since that test, WMT has been trending higher once again. Check out the chart:
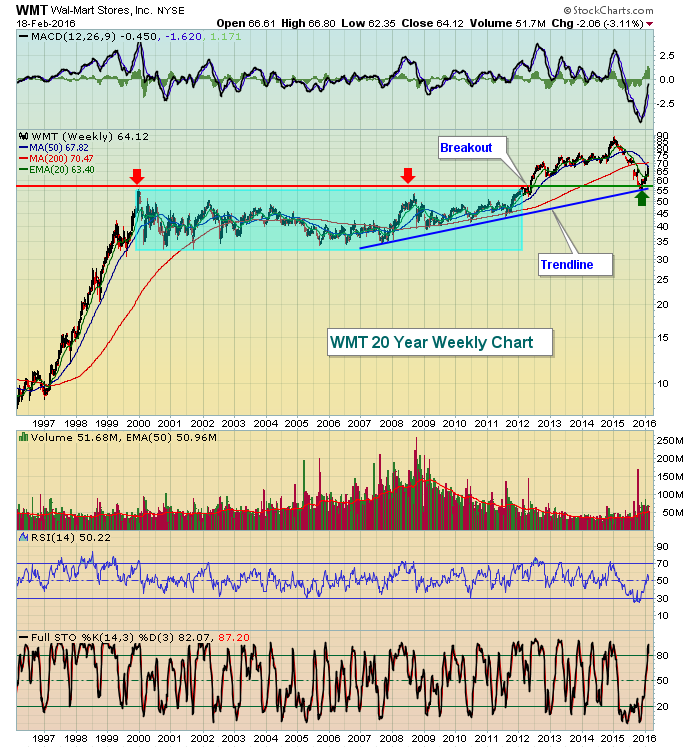 Many short-term traders might see weakness ahead for WMT based on today's action, but the underlying trend appears to be higher to me. Only a push below 55 would make me nervous in the long-term.
Happy trading!
Tom
