Alphabet (GOOGL) is weighing on the Nasdaq 100 ETF as it fails at the 50-day simple moving average and the price relative breaks down. The six month candlestick chart shows GOOGL surging to 800 after earnings and then immediately falling back below 700 in early February. The stock market got a strong bounce the next few weeks, but Alphabet's bounce was rather feeble as the stock barely made it back above its 50-day SMA. A rising wedge formed during this bounce and GOOLG broke wedge support with a sharp downturn the last four days. The stock has failed at the 50-day and the wedge break signals a continuation of the early February decline.
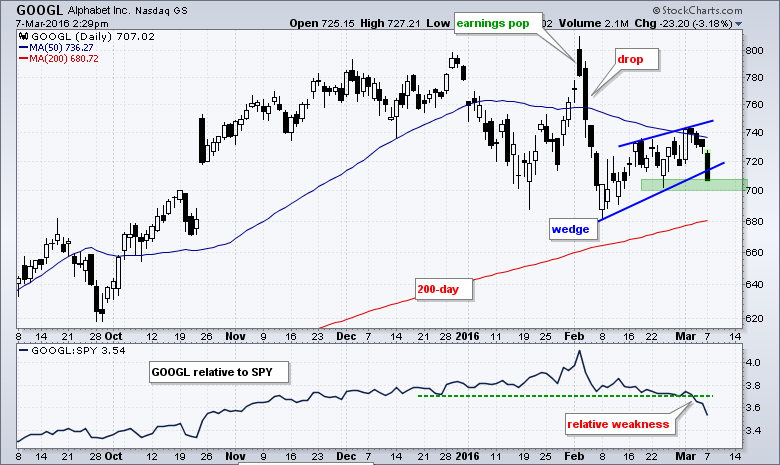
The indicator window shows the price relative (GOOGL:SPY ratio) breaking down last week as GOOGL underperforms the broader market. Note that this ratio peaked in early February and fell to its lowest level since late October.
****************************************
Thanks for tuning in and have a good day!
--Arthur Hill CMT
Plan your Trade and Trade your Plan
****************************************
