The Transport ETF (IYT) has been a great ETF for a technical analysis example. So far, it is carrying the typical information we would expect from a transportation ETF. This basic knowledge principle goes back to Charles Dow, the Father of the Dow Jones Industrial Average. When transports are moving higher, you are in a bull market. Looking at the period from 2012 to late 2014, transports were outperforming the $SPX and the SCTR was pinned above the 75 level for almost 2 years. When an ETF or stock stays above 75, this indicates a leadership group where the price action is behaving better than 75% of its peers. In early 2015, the indicators started to break down. The SCTR, the relative strength to the $SPX, and the 40 Week moving average (40 WMA) all started to break down. For the last 15 months, the transports have underperformed the $SPX and the SCTR shows the transports have not been able to become a leading group.
We can also see a head and shoulders structure, which is a textbook structure for a market top, with a neckline near 140. The low in October 2014, along with the August 2015 low, divide the left shoulder from the head and the right shoulder from the head. After breaking below the neckline, the price action has now retraced and we are testing the neckline from below. This is also classic Technical Analysis. We would expect it to fail here if the broader market is going to continue in a bear market.
Note how the 40 WMA was support all the way up and the 40 WMA has been resistance since the breakdown in early 2015.
Last Friday's close marks an important level. With the neckline and the 40 WMA meeting at the current level of the price, we must be aware of the potential for this rally to stall here. This would also be a condition of classic technical analysis. Seeing the SCTR decline over the last few weeks is not the same signal as the bullish information this ETF provided back in 2012-2013 when it shifted gears to pass into a leadership position.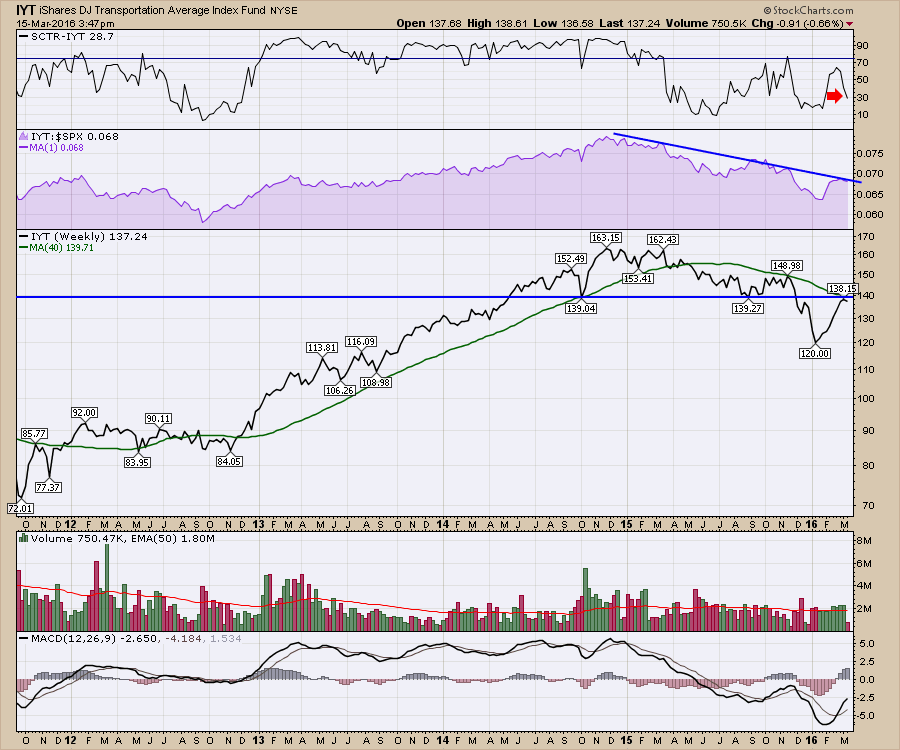
Having the volume come in at the average level for this rally is ok, but notice the enthusiasm in 2013 for a new bull market and compare it to the volume currently. We also have the MACD with a very low level and no positive divergence showing up yet.
This is behaving so well according to our textbooks and this current level is important. A significant breakthrough on higher volume would be bullish. If the Relative Strength in purple pushes above the trend line that would also indicate a change in behaviour. If this can get an SCTR back above 75, this will probably help identify a change in trend as well. So far, the trends of a new bull market are not showing up. These are the points of interest on this chart that provide real clues in identifying the overall market.
However, this is also the place not to take our eyes off the chart. A breakout here would be a nice early signal to get more bullish on the macro trend. You can click on this chart to get a live update in the future.
Good trading,
Greg Schnell, CMT, MFTA
