FLS is a stock that has been pretty much off the radar for two years as a potential long candidate, but this looks to be changing now!
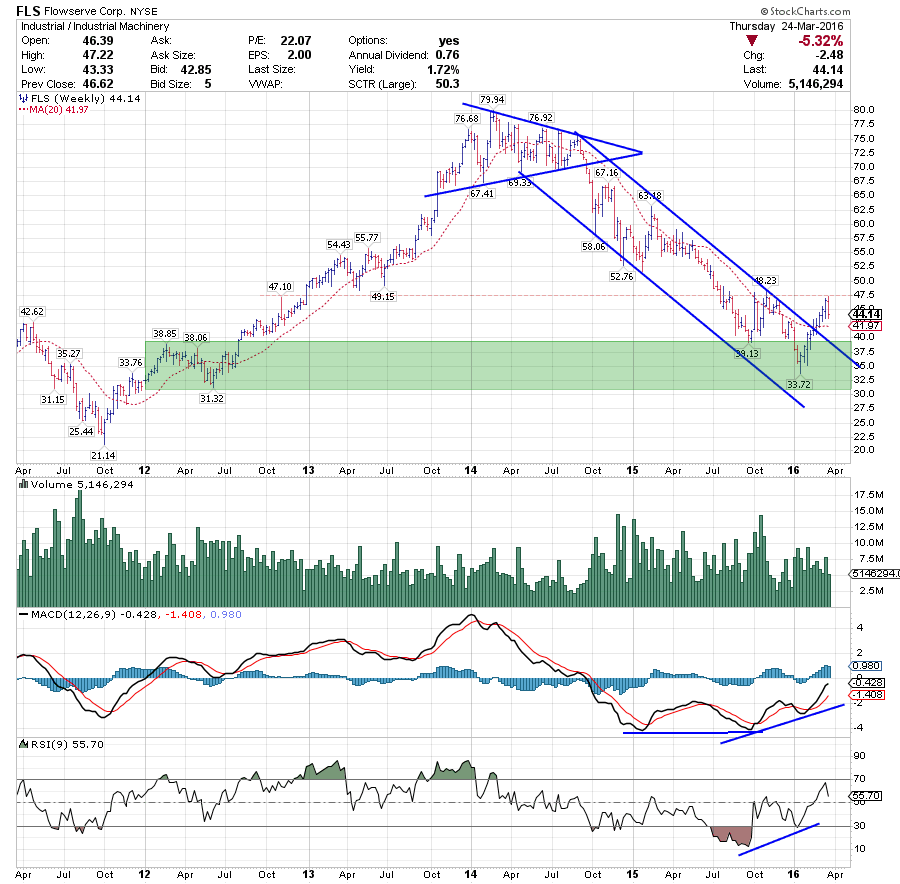 After breaking out of an almost perfect symmetrical triangle in 2014, FLS trended lower until the beginning of this year, when a low ($33.72) formed in the support area offered by the high-low rotation in 2012.
Before the break above the falling resistance line, divergence started to show up in both the MACD and the RSI which often is a prelude to a move higher or, at least, a pause in the existing trend.
Last week the stock price bounced off the horizontal resistance level near $ 47.50 after the recent rally out of the January low. This decline looks to be setting this stock up for renewed buying opportunities either around the level of the 20-day SMA or if that does not hold the September 2015 low near $ 39.
All in all downside risk seems to be fading while upward potential is growing, especially when resistance at $ 47 can be taken out.
Julius
