Intercept Pharmaceuticals (ICPT) has started to look a little more promising. After going ballistic back in January 2014 where the stock went up 7X in a few days, Intercept has been in a slow decline from those fairytale heights. Today, the SCTR ranking broke above 75. The Relative Strength in purple broke the major downtrend and price was able to climb above resistance around $130.
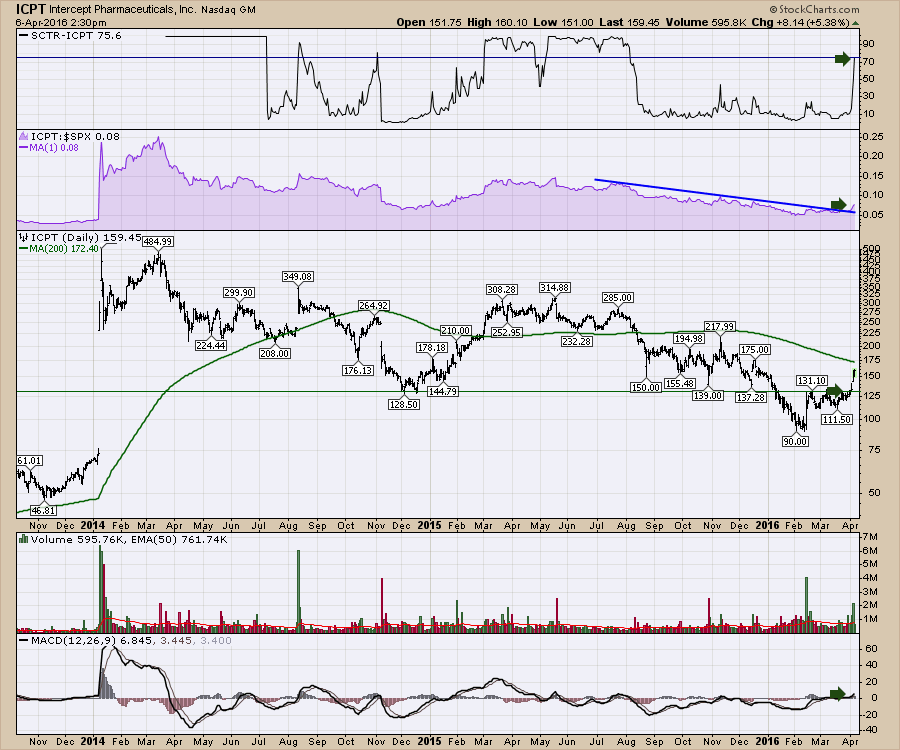
Chart 2 shows the recent price action a little better.
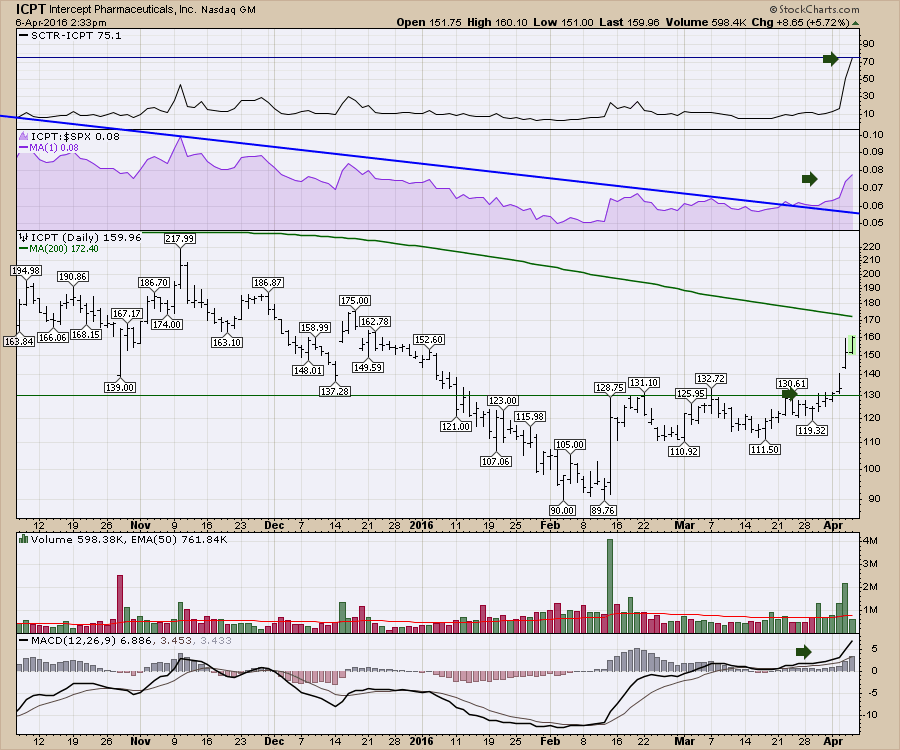 With the volume acceleration and the MACD turning up, this chart is starting to look a lot more investable.
It is nice to see this stock start to develop after such a fabulous surge in 2014. This is a good chart for discussing how to exit ballistic moves quickly. It looks like it could be a great chart for discussing how bases are built now.
There is lots of resistance as we go up, as a lot of people have been underwater sometime in the last two years. A retest of the $130 level before trying to push higher would really be difficult for new buyers as the chart still sports a trend of lower highs and lower lows on the big picture. Having the stock accelerate with volume is a signal that something is changing. A stop at $130 is pretty roomy, so traders might try to use today's low as it is the first pullback since breaking out. Biotech's are notoriously hard to hold. This one looks no different. Trade accordingly.
Good trading,
Greg Schnell, CMT, MFTA.
