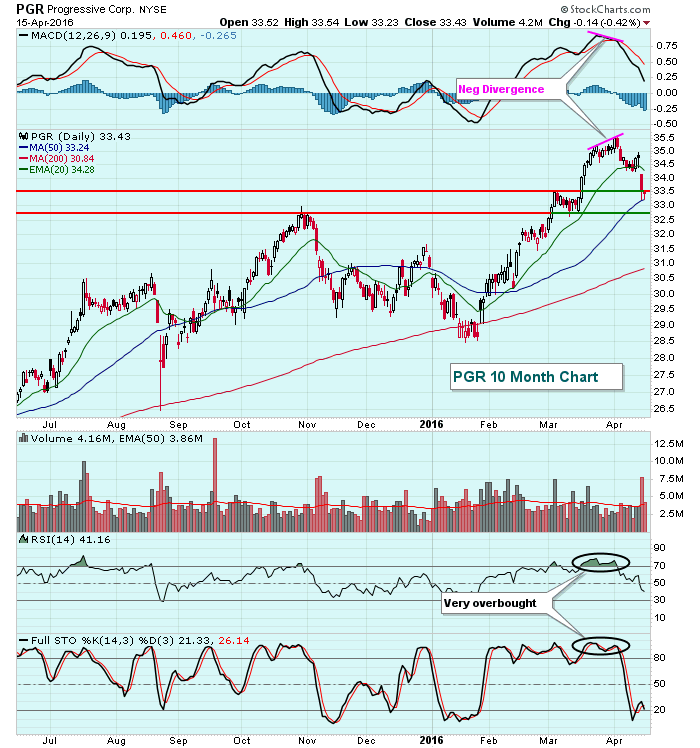
Negative divergences that appear on daily charts tend to take a couple weeks to play out before we see momentum potentially resume back to the upside. That seems to be where Progressive Corp (PGR) currently stands. On PGR's most recent price high, its MACD did not follow suit, resulting in a negative divergence. I generally look for the previously-holding 20 day EMA to fail and a trip down to test the 50 day SMA, together with a MACD centerline "reset". Below you can see how PGR has followed this pattern:
 At the time the negative divergence printed, PGR also was very overbought with an RSI reading in the 70s for two weeks and stochastic close to 100 as well. Also note that the volume was dwindling on its final price high - another sign of slowing momentum. PGR would appear to be a much better reward to risk trading candidate now that its momentum oscillators have dropped and its MACD is nearing centerline support.
Happy trading!
Tom
