Don't Ignore This Chart! May 31, 2016 at 10:15 AM
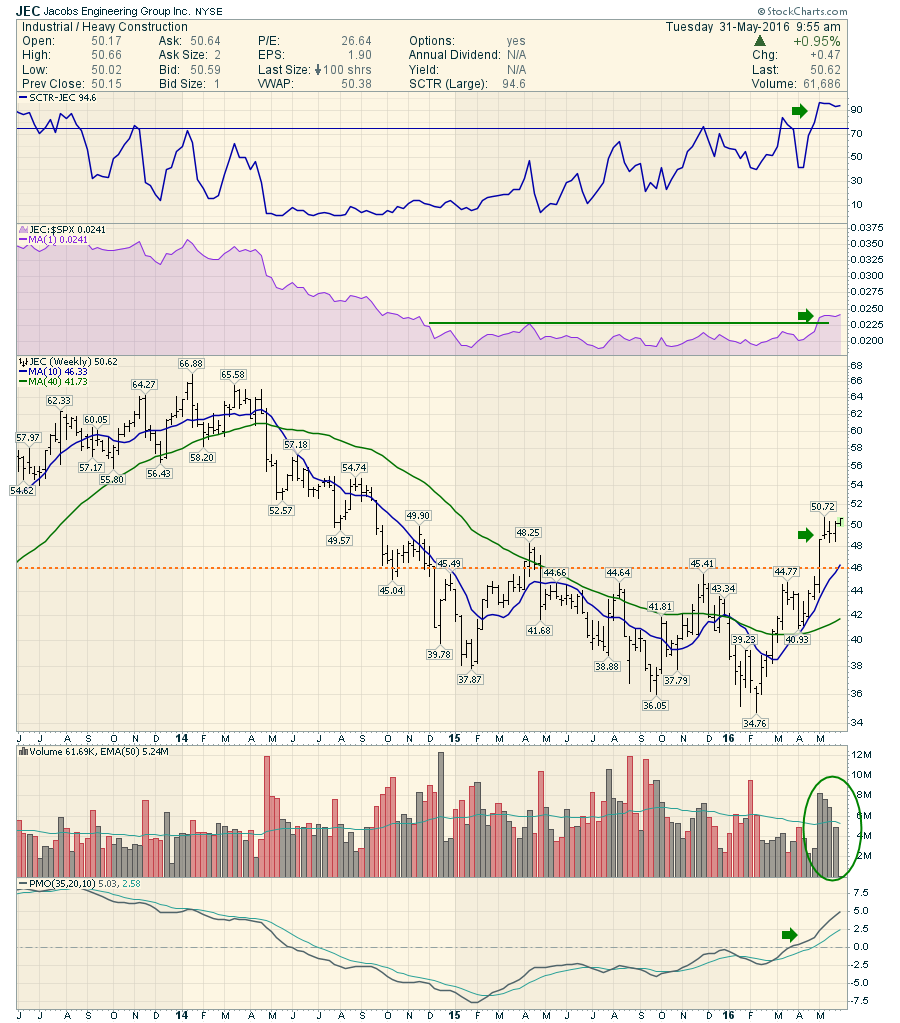
Jacobs Engineering (JEC) has been correcting for almost 2 years. Recently, JEC broke above a basing pattern and is now back above the 40 WMA. The indicators are showing a nice trend developing. The SCTR ranking shows Jacobs performing in the top 10% of all Large Cap stocks... Read More
Don't Ignore This Chart! May 30, 2016 at 03:08 PM
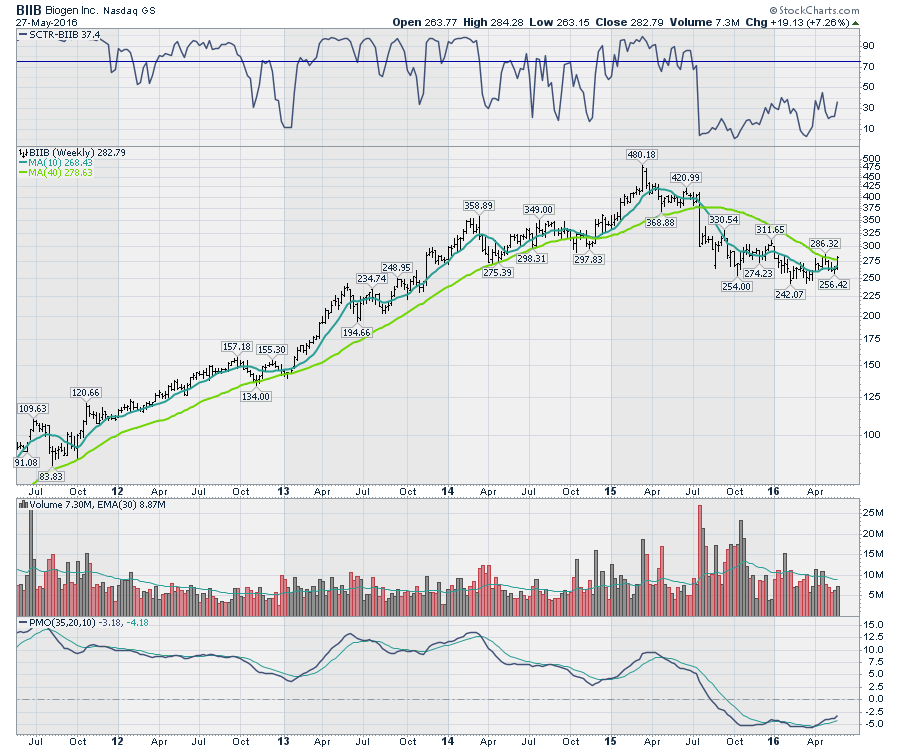
After a year of lower prices for Biogen (BIIB), this week marks a nice rally that could signify the start of a changing trend. Biogen had a massive surge to $480 in the spring of 2015... Read More
Don't Ignore This Chart! May 29, 2016 at 06:18 PM
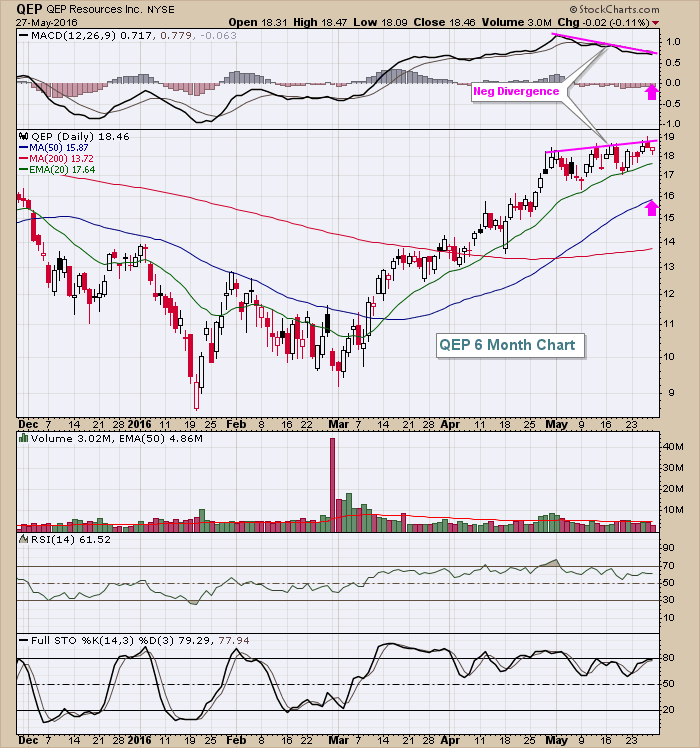
The Dow Jones U.S. Exploration & Production Index ($DJUSOS) is 39% higher since its January low and two mid-cap stocks that are outperforming include $4 billion QEP Resources (QEP) and $2.9 billion WPX Energy (WPX)... Read More
Don't Ignore This Chart! May 29, 2016 at 12:43 AM
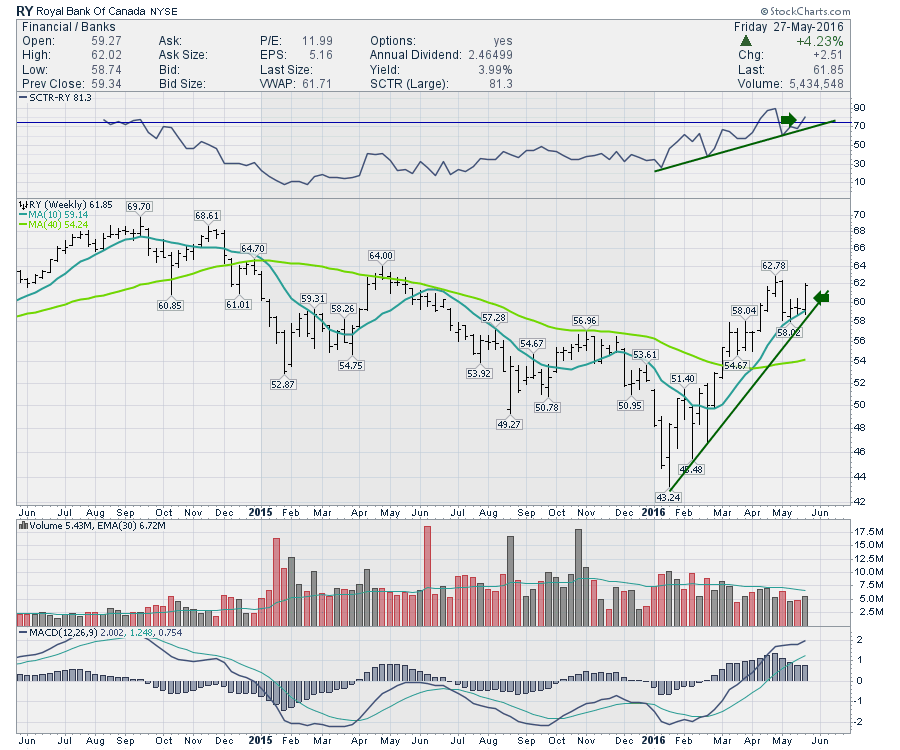
Canadian bank stocks are all high up the large cap SCTR ranking tables. RBC (RY) is Canada's largest bank. The SCTR pushed up on the back of the Fed minutes but it was working up there in April before the financials surged this week... Read More
Don't Ignore This Chart! May 26, 2016 at 02:01 PM
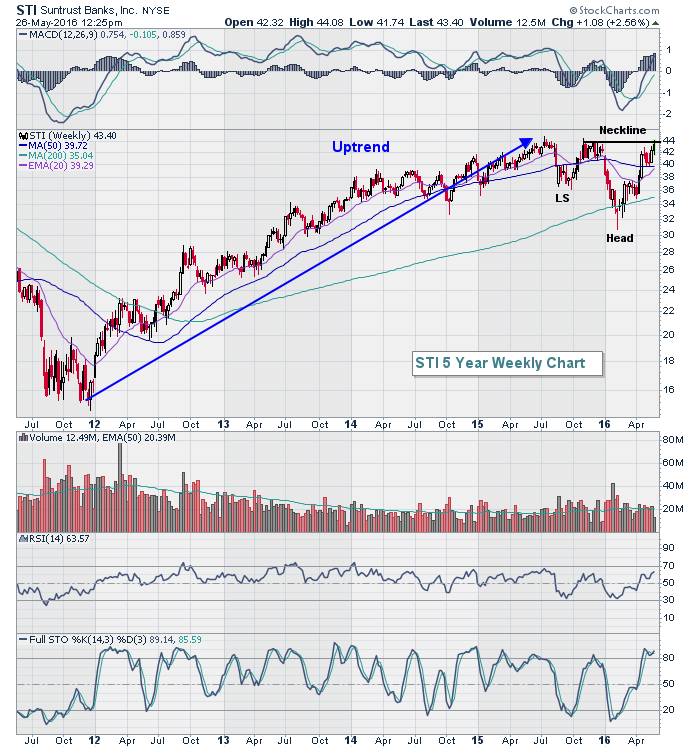
SunTrust Banks (STI) looks very bullish on a longer-term weekly chart, awaiting a critical technical breakout. But on its daily chart, there are signs of slowing momentum and overbought conditions as price resistance nears... Read More
Don't Ignore This Chart! May 25, 2016 at 10:51 AM
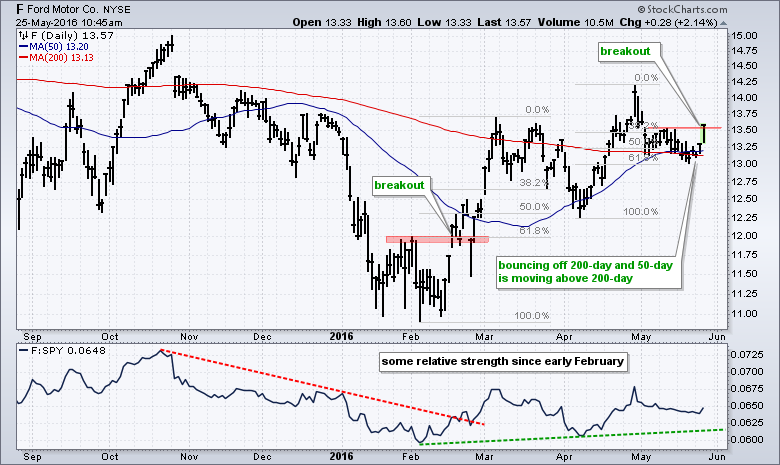
Ford is making a big statement today with a successful test of the 200-day moving average and a break above the mid May high. The chart shows Ford (F) surging in February for its first breakout at 12. After exceeding 13.50, the stock retraced 50-62% with a pullback to the 12... Read More
Don't Ignore This Chart! May 24, 2016 at 06:08 PM
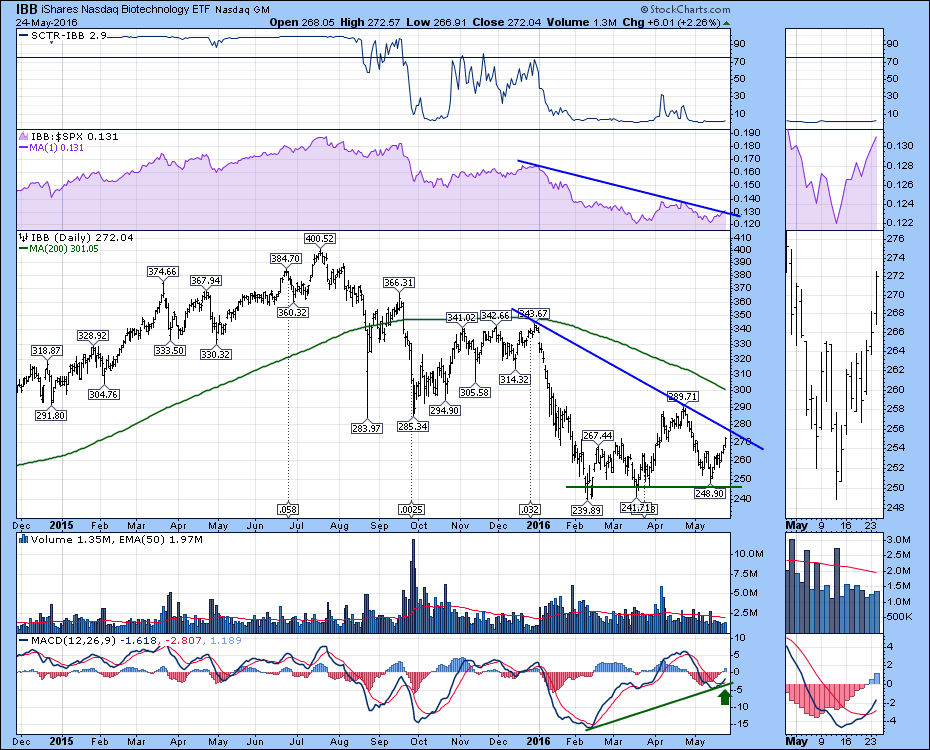
The Healthcare sector has been out of favor and the Biotech ETF (IBB) was tossed into the bonfire with the rest of the sector. The SCTR is still demonstrating that the IBB is one of the worst performing ETFs in the market... Read More
Don't Ignore This Chart! May 23, 2016 at 11:45 AM
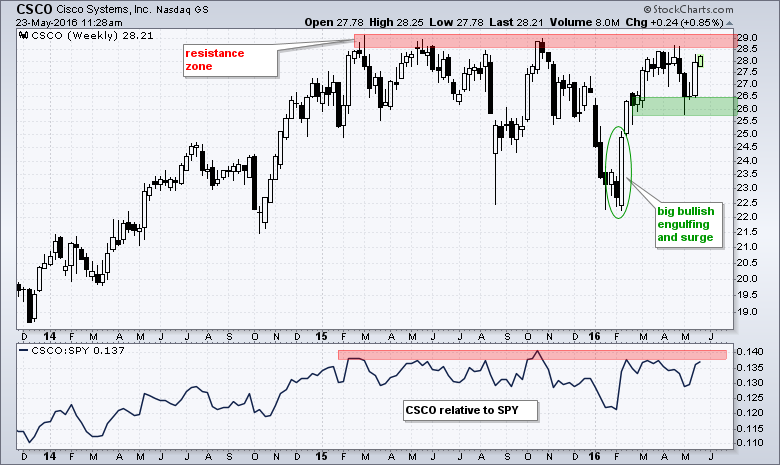
Stocks hitting 52-week highs are in clear uptrends and they are the market leaders. I am not going to feature a stock hitting a new high today, but rather look at one that has a good chance of hitting a new high in the coming weeks... Read More
Don't Ignore This Chart! May 22, 2016 at 10:31 PM
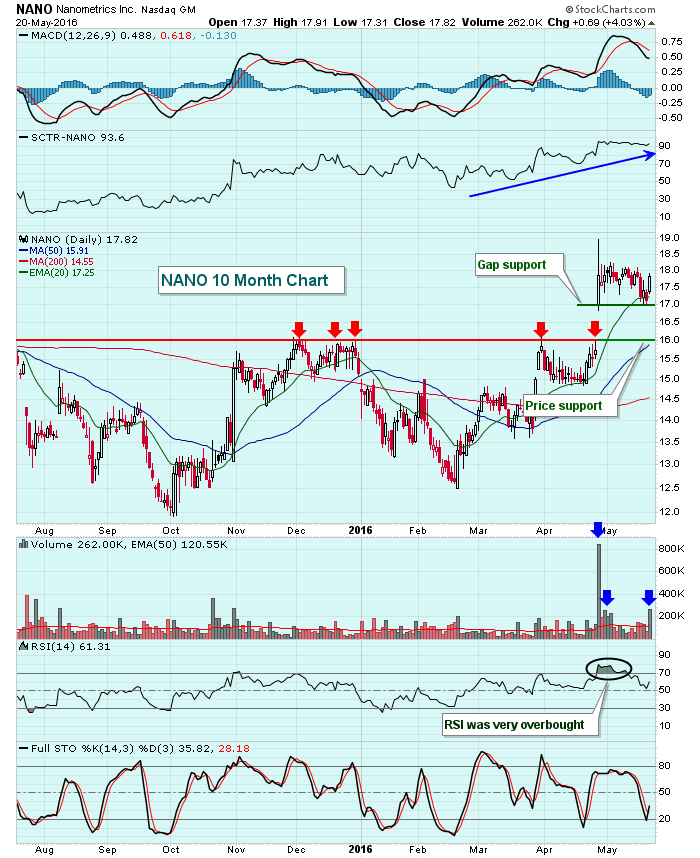
A little more than three weeks ago, a very small $435 million semiconductor company reported quarterly EPS that nearly tripled Wall Street consensus estimates. Quarterly revenues also beat estimates by roughly 3%... Read More
Don't Ignore This Chart! May 19, 2016 at 05:47 PM
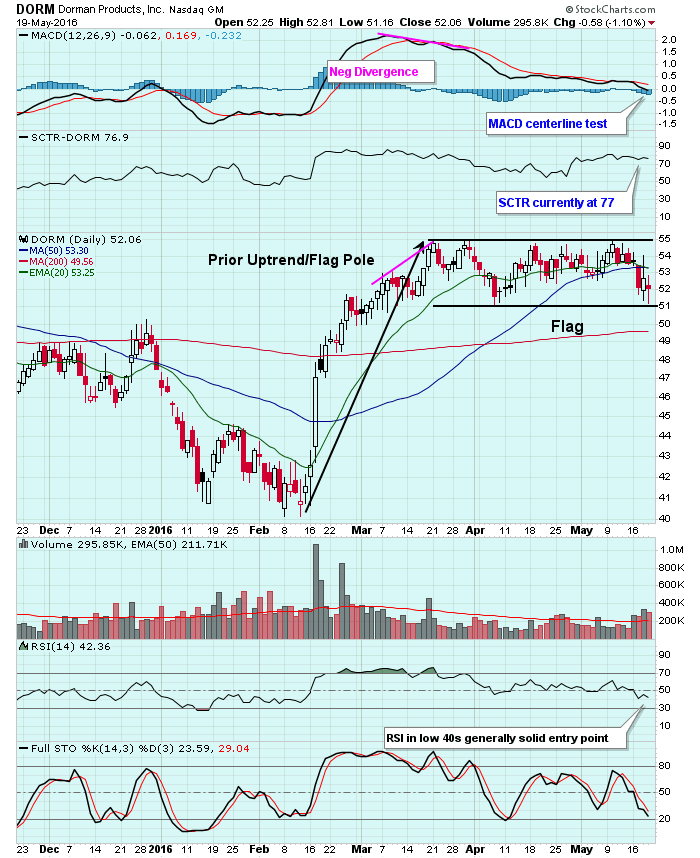
Dorman Products (DORM) touched price support near 51.00, which is technically significant as DORM has been trading in a continuation pattern for the past several weeks and 51.00 has marked flag support... Read More
Don't Ignore This Chart! May 18, 2016 at 11:42 AM
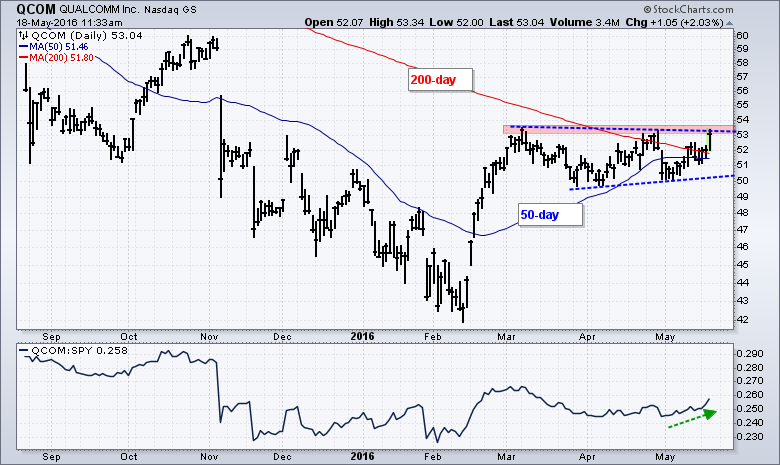
QualCom has been going nowhere since early March, but a breakout may be in the making as the stock distances itself from two key moving averages. The chart shows QCOM with the 50-day and 200-day SMAs in the 51-52 area... Read More
Don't Ignore This Chart! May 17, 2016 at 03:39 PM
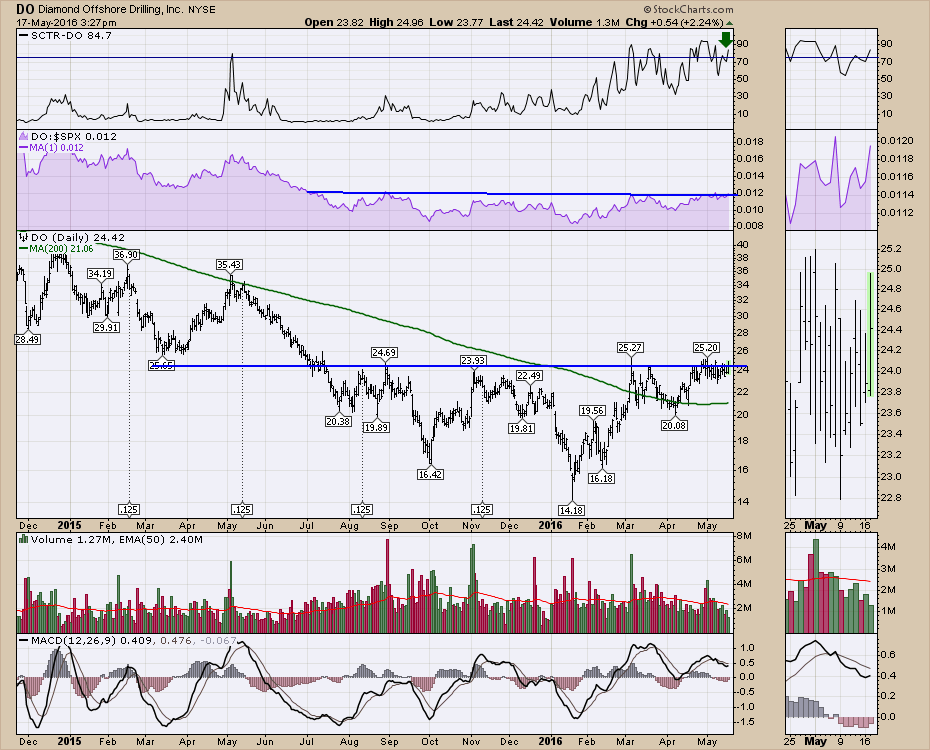
After a severe, correction going on 2 years, Diamond Offshore Drilling (DO) has built a nice big base. With Crude Oil approaching $50, the sentiment against oil seems to be losing energy. These big bases are important in the stock trend... Read More
Don't Ignore This Chart! May 16, 2016 at 12:22 PM
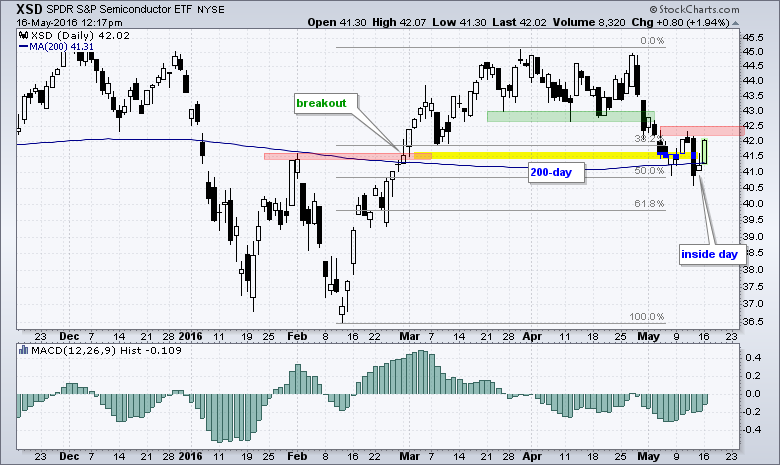
The Semiconductor SPDR (XSD) is one the leading industry-group ETFs at midday on Monday with a gain of around 2%. A look at the chart shows this big gain coming at a potential support or reversal zone. First, notice that XSD broke resistance with a big move in February... Read More
Don't Ignore This Chart! May 15, 2016 at 04:59 PM
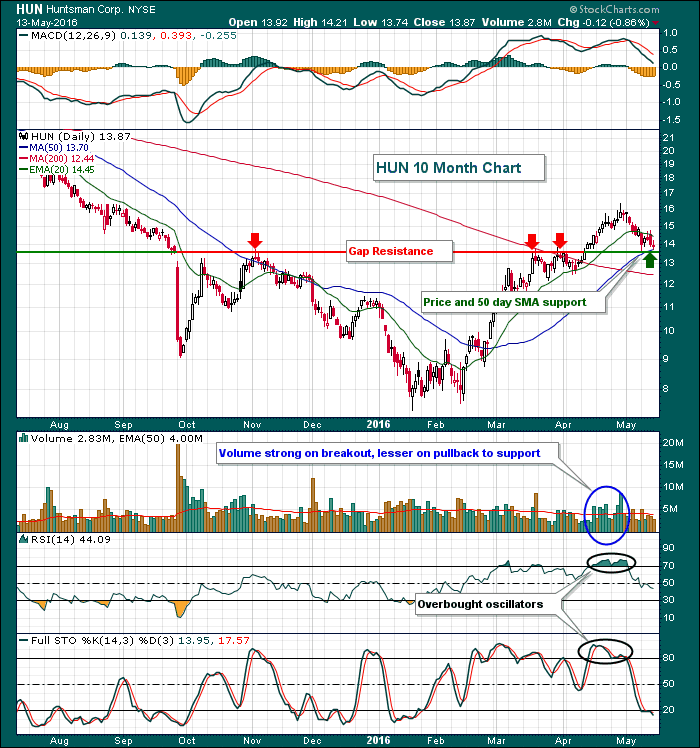
Not many stocks have been spared the past few weeks as our major indices have trended lower. Huntsman Corp (HUN) doubled in a little more than two months, but became very overbought in late April... Read More
Don't Ignore This Chart! May 13, 2016 at 10:52 AM
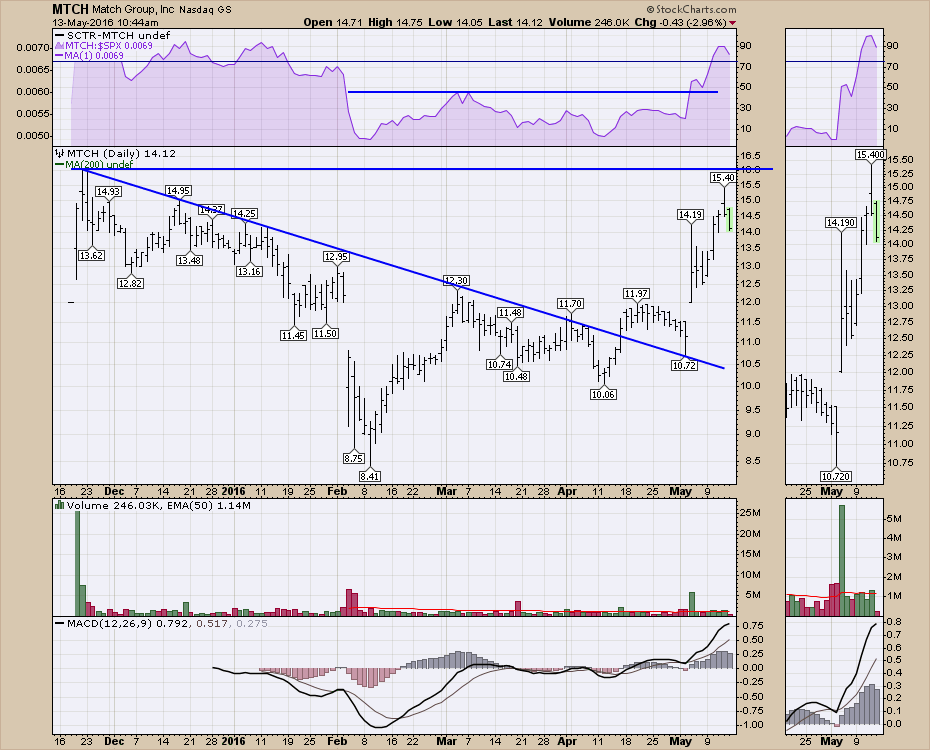
This investing business is a fickle world. Trying to find the right stock at the right time to stay invested in is hard work. Well, the world of relationship matching is also a world of right place, right time synergy... Read More
Don't Ignore This Chart! May 12, 2016 at 02:54 PM
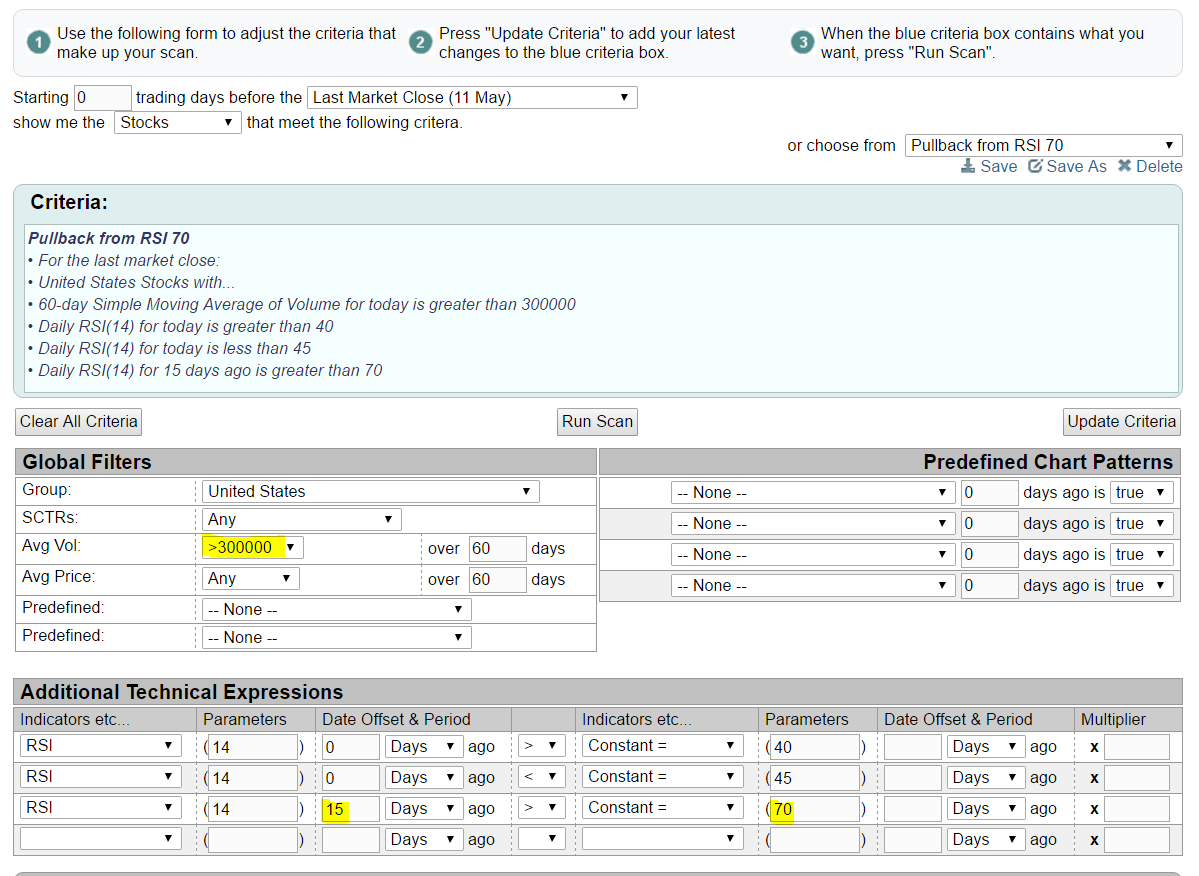
Overbought stocks frequently move above RSI 70, but during periods of selling or consolidation, it's fairly routine to see the RSI dip back to the 40-45 area... Read More
Don't Ignore This Chart! May 11, 2016 at 12:11 PM
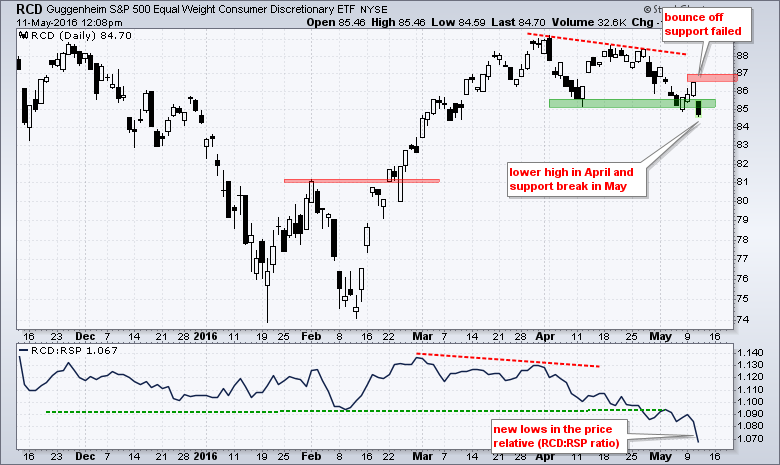
The EW Consumer Discretionary ETF (RCD) got a bounce off support Monday-Tuesday, but gave it all back on Wednesday and broke support with a sharp decline. The chart shows the ETF forming a lower high in April and ultimately breaking support on Wednesday with a gap down... Read More
Don't Ignore This Chart! May 10, 2016 at 03:06 PM
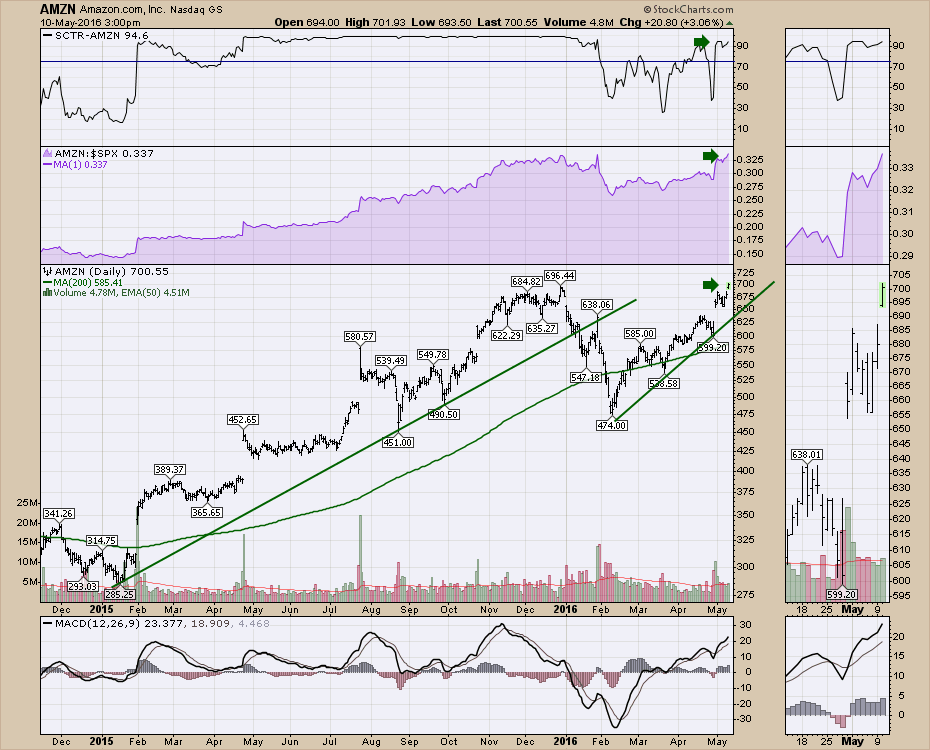
Amazon (AMZN) continues to another all-time high today. This stock continues to work higher. After writing about Amazon in January, AMZN dropped another $100 / share. Today it looks to close at new all-time highs... Read More
Don't Ignore This Chart! May 09, 2016 at 11:48 AM
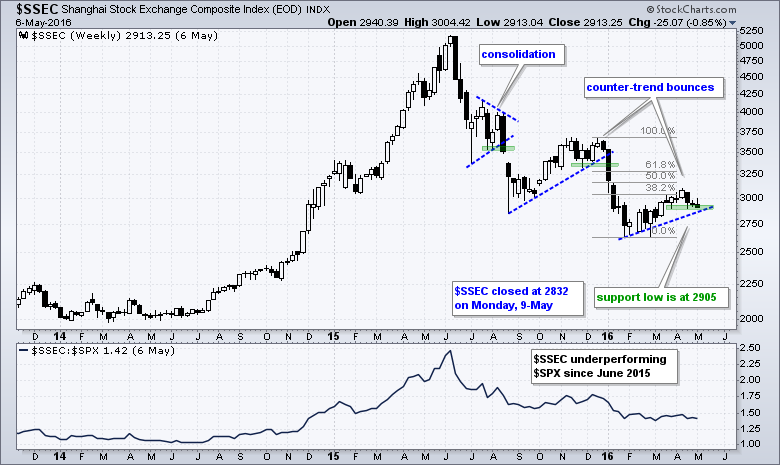
The Shanghai Composite ($SSEC) took a hit on Monday and closed below support from the April low. This move is reversing the counter-trend bounce and signaling a continuation of the bigger downtrend... Read More
Don't Ignore This Chart! May 08, 2016 at 07:15 PM
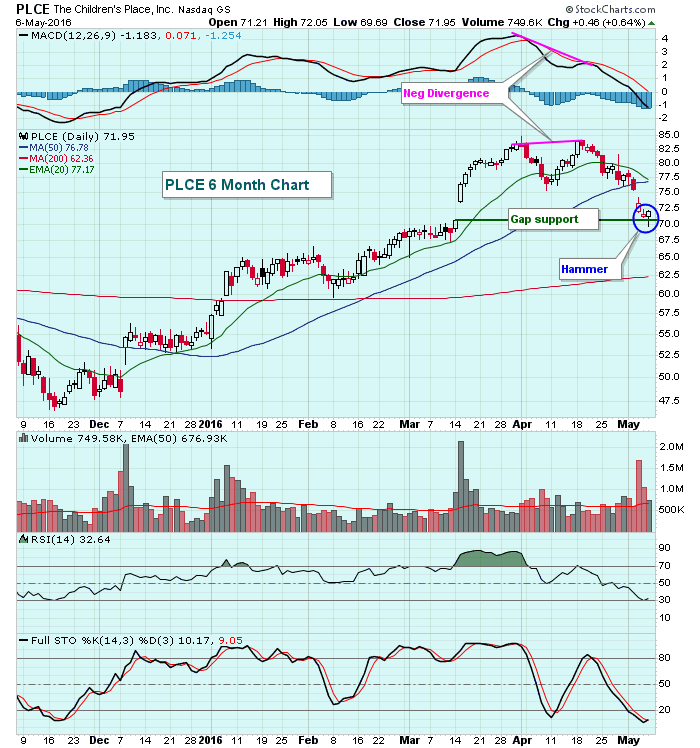
Children's Place (PLCE) printed a reversing hammer on Friday just after touching gap support at 70.51. This comes off a lengthy downtrend that began in mid-April after a negative divergence had developed... Read More
Don't Ignore This Chart! May 06, 2016 at 10:10 AM
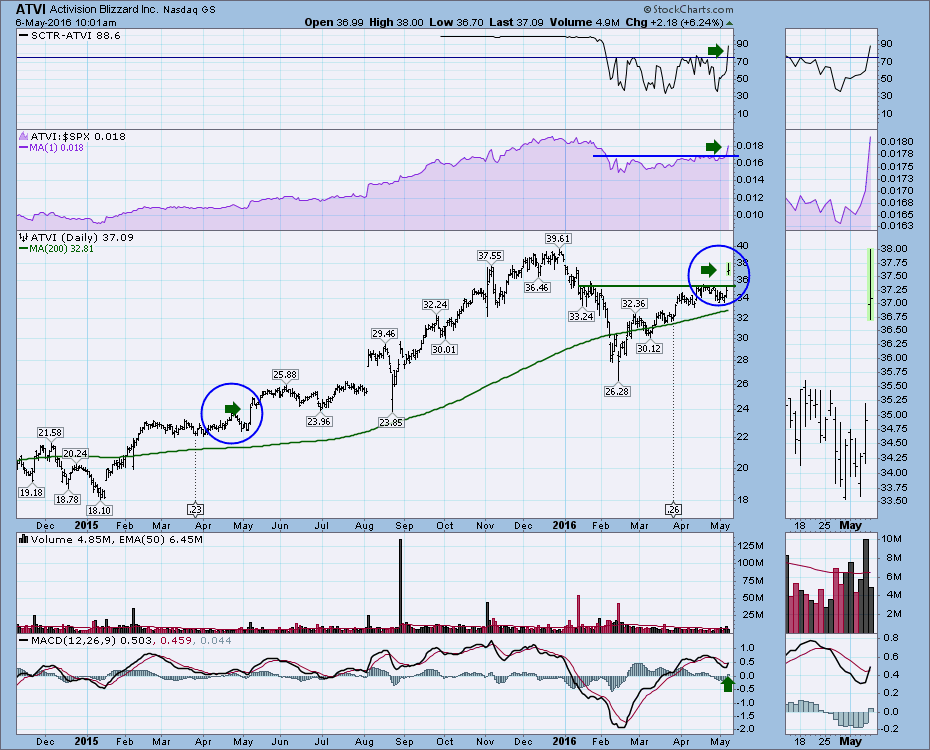
ATVI - Activision announced a positive response to the Call Of Duty : Heroes software release. After a fantastic 2015 (100% gain), ATVI took a short break in the uptrend. Now, it looks to be resuming it's investor enthusiasm... Read More
Don't Ignore This Chart! May 05, 2016 at 03:18 PM
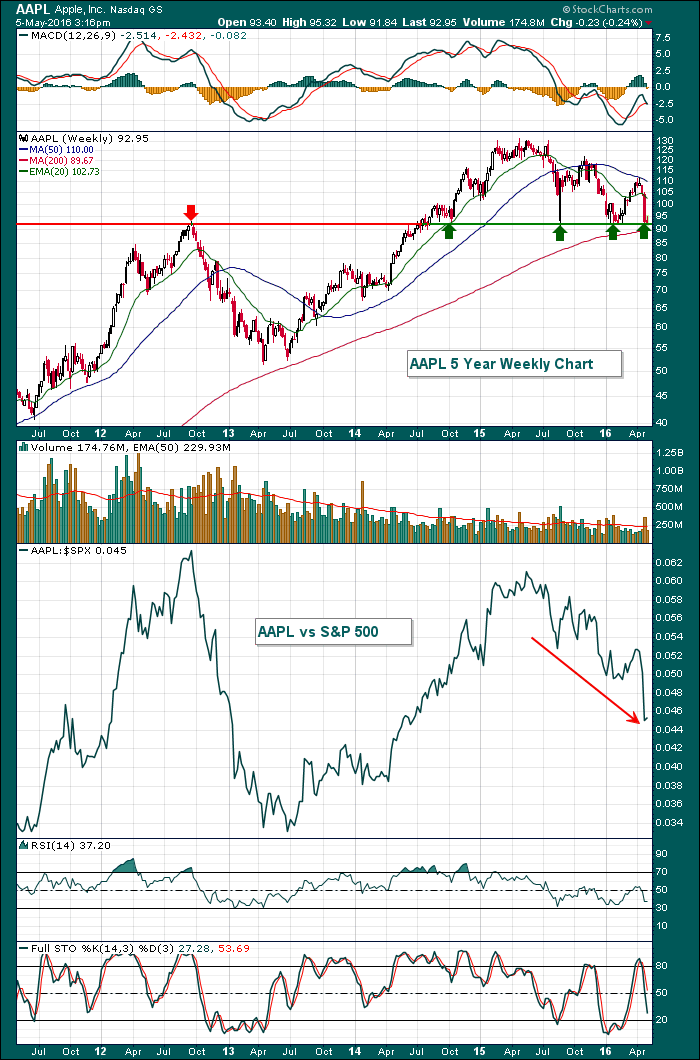
Apple (AAPL) is the most influential stock considering all its branches and its psychological effect, not to mention its $510 billion market cap... Read More
Don't Ignore This Chart! May 04, 2016 at 11:21 AM
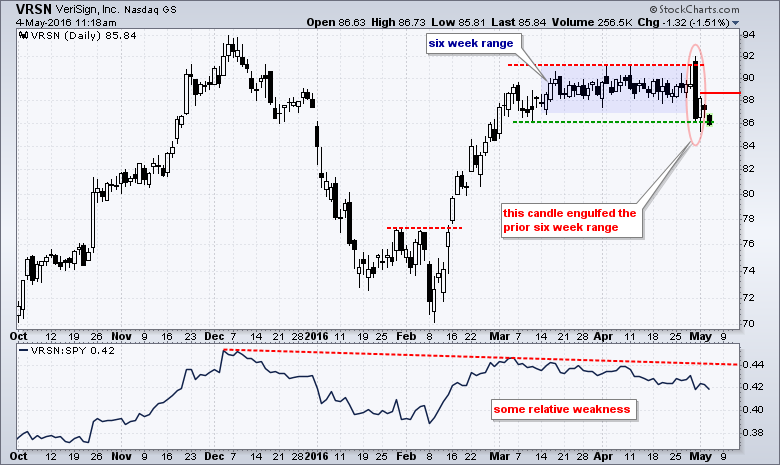
There are bearish engulfing patterns and then there are BEARISH ENGULFING patterns. VeriSign formed the latter with one of the biggest I have seen in some time. The chart shows the bearish engulfing pattern opening above the April high and finishing near the early March low... Read More
Don't Ignore This Chart! May 03, 2016 at 09:34 AM
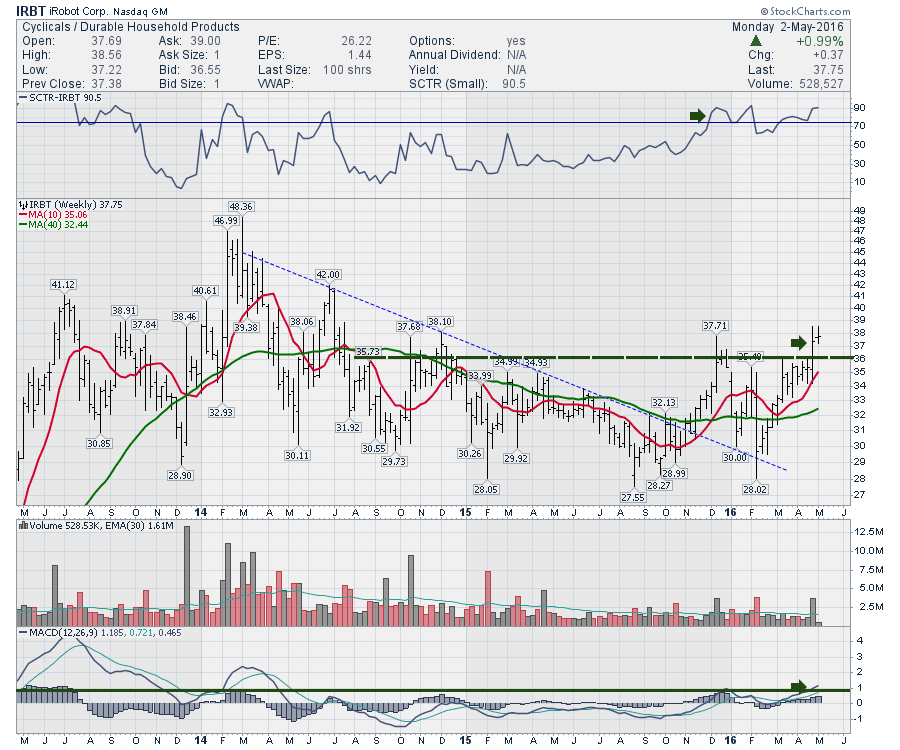
Having a Roomba has been a simple pleasure. Roomba is a robotic vacuum for your home so you can golf instead of vacuum. iRobot (IRBT) is the parent company. The company has an interesting chart this week... Read More
Don't Ignore This Chart! May 02, 2016 at 11:34 AM
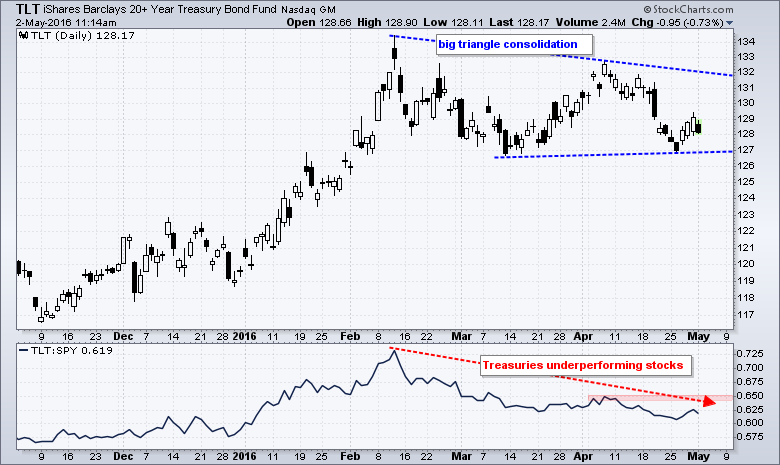
The first week of the month is always a big week for Treasury bonds and the 20+ YR T-Bond ETF (TLT). There are always a slew of key economic reports and the employment report is usually the first Friday of the month... Read More