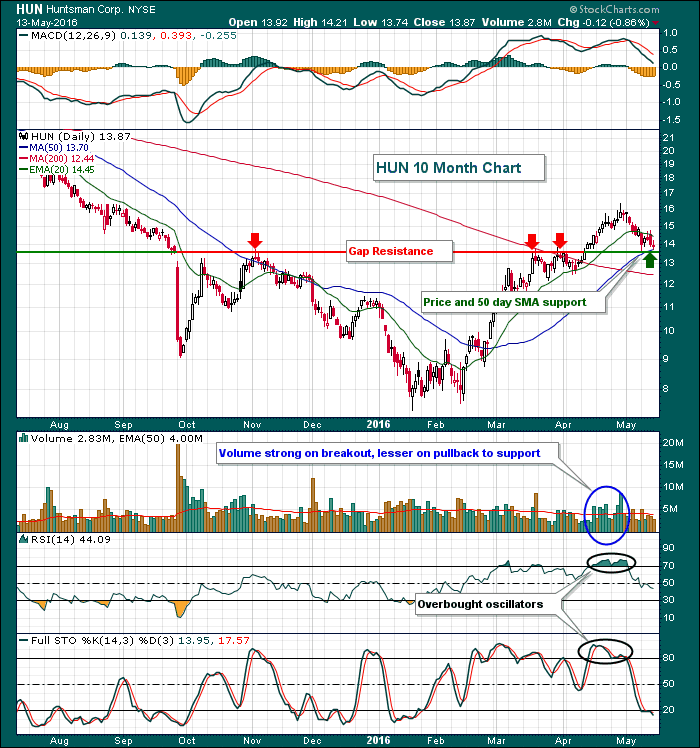
Not many stocks have been spared the past few weeks as our major indices have trended lower. Huntsman Corp (HUN) doubled in a little more than two months, but became very overbought in late April. Since that time, HUN has fallen 15% and its overbought oscillators have seen relief with the RSI and stochastic now at 44 and 14, respectively. Volume was quite strong on the breakout above 13.50-13.60 gap resistance and has subsided on the recent selling. Finally, HUN has tested price support and reached its 50 day SMA for the first time since crossing above it in late February. Check out the chart:
 Happy trading!
Tom

About the author:
Tom Bowley is the Chief Market Strategist of EarningsBeats.com, a company providing a research and educational platform for both investment professionals and individual investors. Tom writes a comprehensive Daily Market Report (DMR), providing guidance to EB.com members every day that the stock market is open. Tom has contributed technical expertise here at StockCharts.com since 2006 and has a fundamental background in public accounting as well, blending a unique skill set to approach the U.S. stock market.
Learn More