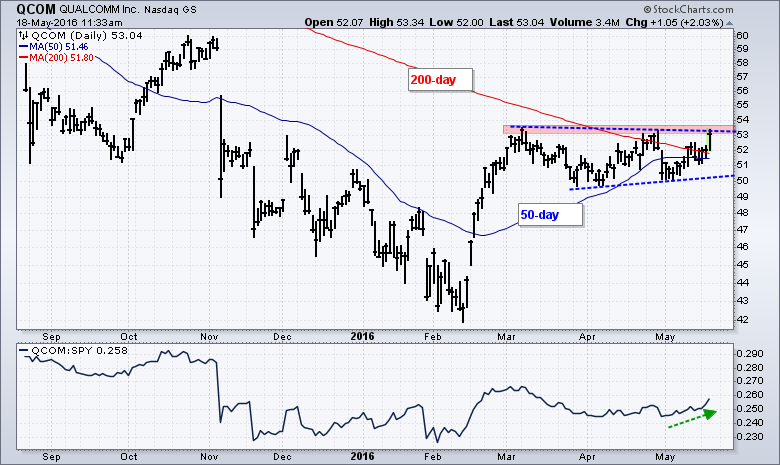
QualCom has been going nowhere since early March, but a breakout may be in the making as the stock distances itself from two key moving averages. The chart shows QCOM with the 50-day and 200-day SMAs in the 51-52 area. The stock has bounced between 50 and 53 since early March and formed a long triangle consolidation with these moving averages in the middle. The stock caught my eye today because it surged to resistance with a strong move. A breakout here would signal a continuation of the February surge and put QCOM in a long-term uptrend. The indicator window shows the price relative turning up in May as QCOM starts to outperform the broader market this month.
 ****************************************
Thanks for tuning in and have a great day!
--Arthur Hill CMT
Plan your Trade and Trade your Plan
*****************************************
