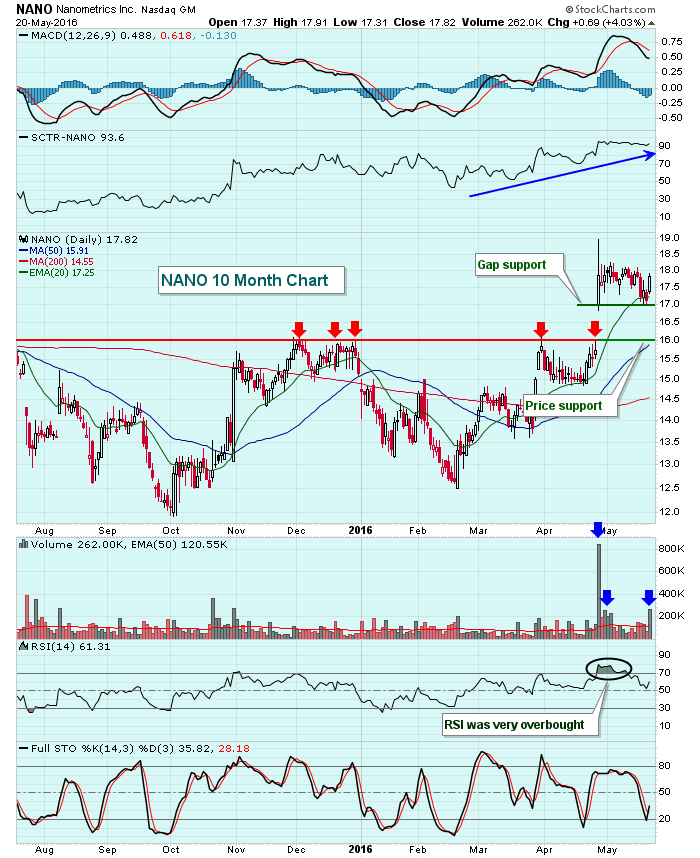
A little more than three weeks ago, a very small $435 million semiconductor company reported quarterly EPS that nearly tripled Wall Street consensus estimates. Quarterly revenues also beat estimates by roughly 3%. That combination sent Nanometrics (NANO) soaring on April 27th, at one point up 20% on the session. NANO became overbought at that point and has spent the past few weeks consolidating with its RSI falling from 80 to nearly 50. The top of gap support at 16.99 and price support at 16 should offer up an excellent reward to risk long entry should the price of NANO move to those levels. A closing breakout above 18.14 would be bullish. Check out the chart:
 While the action here is clearly bullish to me, there is an issue regarding liquidity. Volume has been stronger the past few weeks, but over the longer-term NANO tends to trade fewer than 200,000 shares per day, and many days fewer than 100,000 shares.
Happy trading!
Tom
