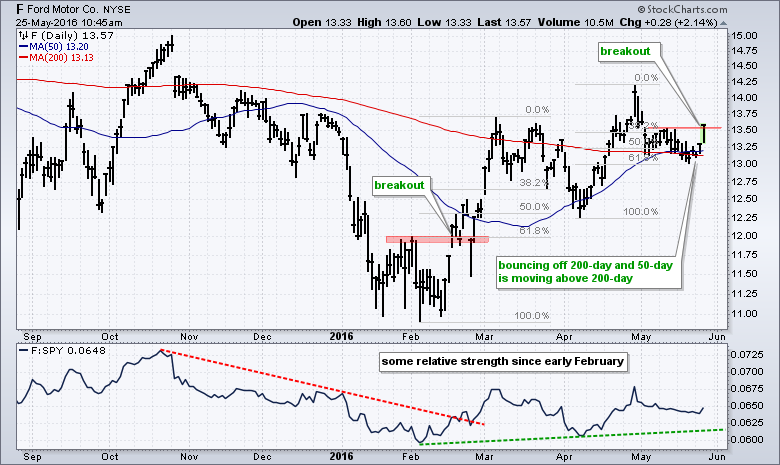
Ford is making a big statement today with a successful test of the 200-day moving average and a break above the mid May high. The chart shows Ford (F) surging in February for its first breakout at 12. After exceeding 13.50, the stock retraced 50-62% with a pullback to the 12.25 area. A higher low formed as Ford again surged and forged a higher high in April. The subsequent pullback again retraced 50-62% of the April advance and the stock bounced the last four days. With higher highs and higher lows, there is a clear two steps forward and one step backward sequence over the last few months. This amounts to an uptrend and this uptrend is confirmed with the key moving averages. Chartists can mark first support at 13.
 ****************************************
Thanks for tuning in and have a great day!
--Arthur Hill CMT
Plan your Trade and Trade your Plan
*****************************************
