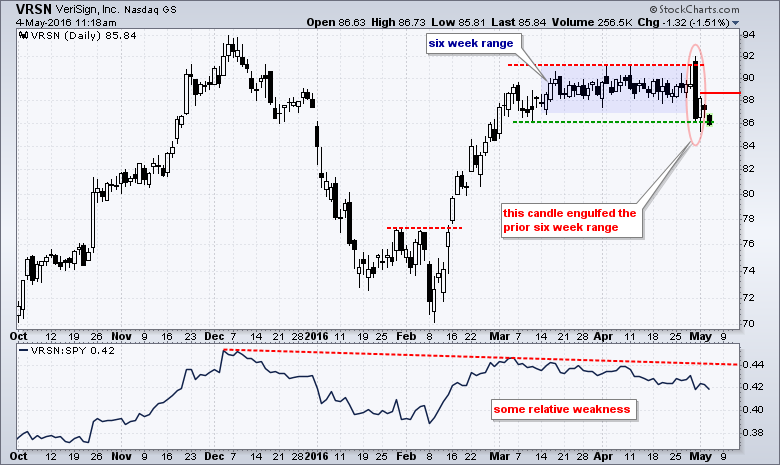
There are bearish engulfing patterns and then there are BEARISH ENGULFING patterns. VeriSign formed the latter with one of the biggest I have seen in some time. The chart shows the bearish engulfing pattern opening above the April high and finishing near the early March low. The stock got a small bounce off the support level and then moved lower on Thursday. A break below support would confirm the bearish engulfing and signal the start of a downtrend. I would consider this support break valid as long as the stock remains below 88.50 (red line). The indicator window shows the price relative (VRSN:SPY ratio) moving lower since March as the stock underperforms the broader market.
****************************************
Thanks for tuning in and have a great day!
--Arthur Hill CMT
Plan your Trade and Trade your Plan
*****************************************
