Chartists need just two plots to find leaders and stocks in uptrends: price and the price relative. Price, of course, can be a line chart, bar chart or candlestick chart. Stocks hitting 52-week highs are in clear uptrends and often leading the market. Bristol Meyers is one such stock because it hit a 52-week high in early June. In addition, the stock held just above the May lows during the June pullback. I view these May lows as "benchmark" lows that chartists can use to compare charts. Stocks holding above the May lows show relative chart strength. Stocks breaking their May lows show relative chart weakness. BMY held its May low during the wedge pullback and broke the wedge trend line with a surge on Wednesday.
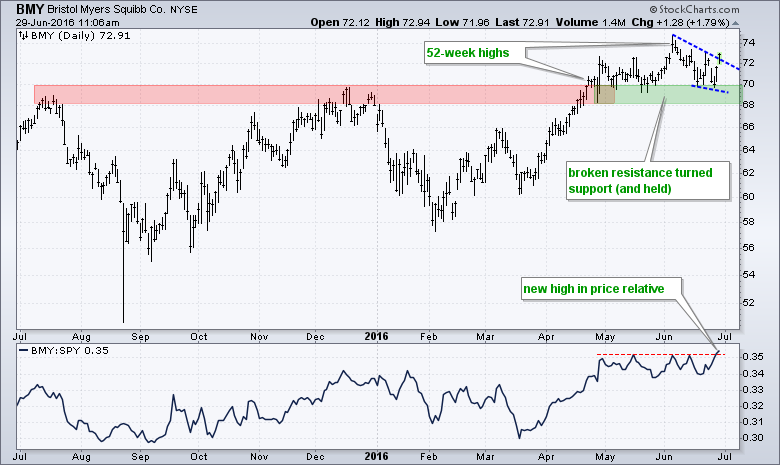
The price relative is a ratio plot of the stock versus the benchmark index, usually the S&P 500. The BMY:SPY ratio rises when BMY outperforms SPY and falls when BMY underperforms. This ratio bottomed in May and hit a new high in April. After moving sideways for a few months, the ratio turned back up again this week and hit another new high. This indicates that BMY is outperforming SPY.
****************************************
Thanks for tuning in and have a great day!
--Arthur Hill CMT
Plan your Trade and Trade your Plan
*****************************************
