There's a potential bottoming reverse head & shoulders pattern in play on Western Digital's (WDC) three year weekly chart as it attempts to clear its downtrend on its SCTR. All of this comes on the heels of printing a positive divergence on its MACD. This alone would have me looking for a 50 week SMA test, with that moving average currently residing at 56.70. Here's the visual:
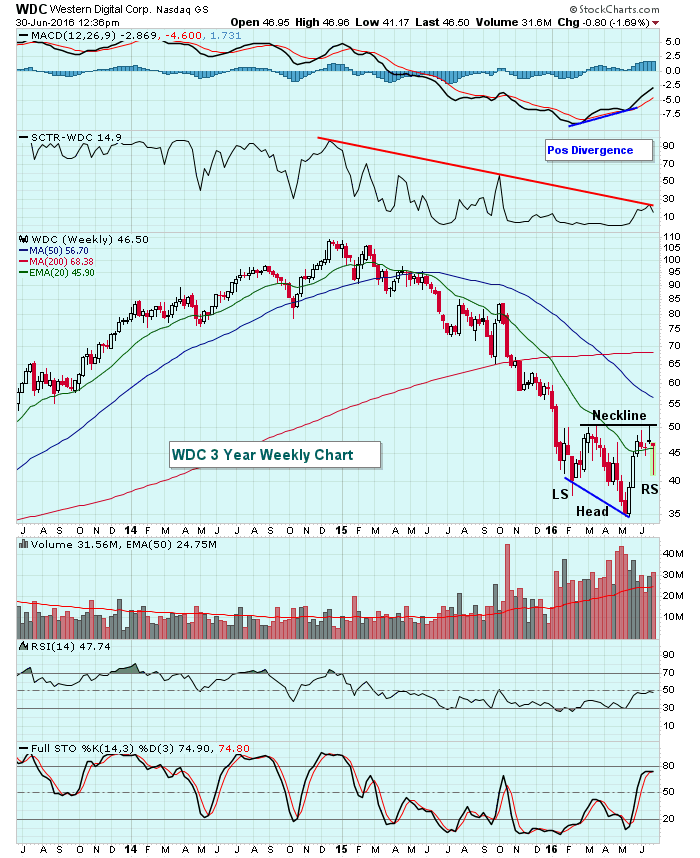 While we still have one more trading day left this week, currently the weekly candle is that of a dragonfly doji. Considering it marks a potential reverse right shoulder and is accompanied by heavy volume, I believe the odds are increasing that WDC will eventually break above neckline resistance. If it does, the measurement would be to roughly 65.00. Technically, this is the best that WDC has looked since its breakdown in early 2015.
Happy trading!
Tom
