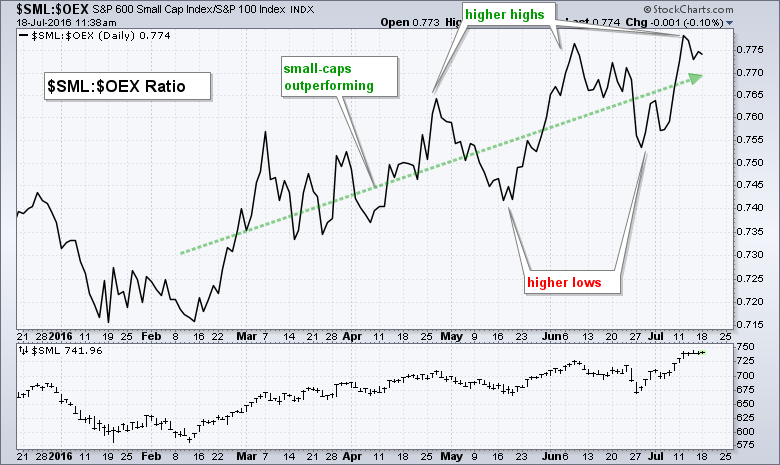
The S&P Small-Cap 600 has been leading the S&P 500 since mid February as a key ratio chart hit a multi-month high last week. The main window in the chart below shows the $SML:$OEX ratio, which plots the performance of the S&P Small-Cap 600 relative to the S&P LargeCap 100. This ratio rises when small-caps outperform large-caps and falls when small-caps underperform. Note that this ratio bottomed in mid February and zigzagged higher the last five months. Thus, relative strength in small-caps is nothing new for stocks. On the chart, each peak was higher than the prior peak and each trough was higher than the prior trough. This is classic outperformance by one symbol against another. Relative strength in small-caps shows a strong appetite for risk in 2016 and this is positive for the market overall.
 ****************************************
Thanks for tuning in and have a great day!
--Arthur Hill CMT
Plan your Trade and Trade your Plan
*****************************************
