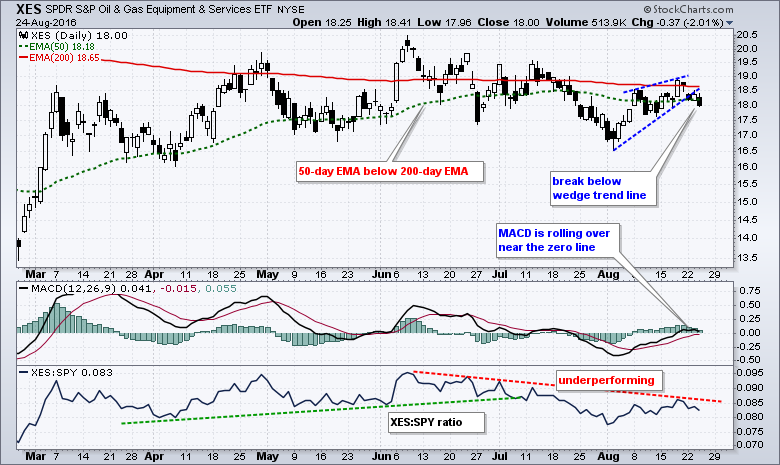
The Oil & Gas Equip & Services SPDR (XES) looks vulnerable because the bigger trend is down and the ETF just broke a wedge trend line. The chart shows the 50-day EMA (green) below the 200-day EMA (red) and this suggests that a long-term downtrend remains underway. The ETF got a bounce in August, but a rising wedge formed and XES broke the wedge trend line with a decline the last three days. This reverses the short-term upswing and signals a continuation of the bigger downtrend. The indicator window shows MACD flattening out just above the zero line. A downturn and move below the signal line would be bearish for momentum. And finally, notice that the XES:SPY ratio peaked in early June and XES has underperformed the broader market the last two months.
 ****************************************
Thanks for tuning in and have a great day!
--Arthur Hill CMT
Plan your Trade and Trade your Plan
*****************************************
