One of the difficult parts of the current market is the dichotomy between the rally to new highs in the indexes and the continued struggles of the banking group with its third lower high in the past year. KBE is the SPDR ETF for the big banks. When the banks don't participate that is usually worrisome. If we walk through the indicators one at a time, there is some valuable advice there.
The SCTR is below 50. We can see a horizontal line placed at the 50 level. Currently, the Bank ETF SCTR is at 26.3 making it one of the worst-performing ETF's. The ETF is underperforming the broad moves in the market. The Relative Strength measurement to the $SPX shown in purple is underperforming once again and this gives us a reason to question the strength of this bull move.
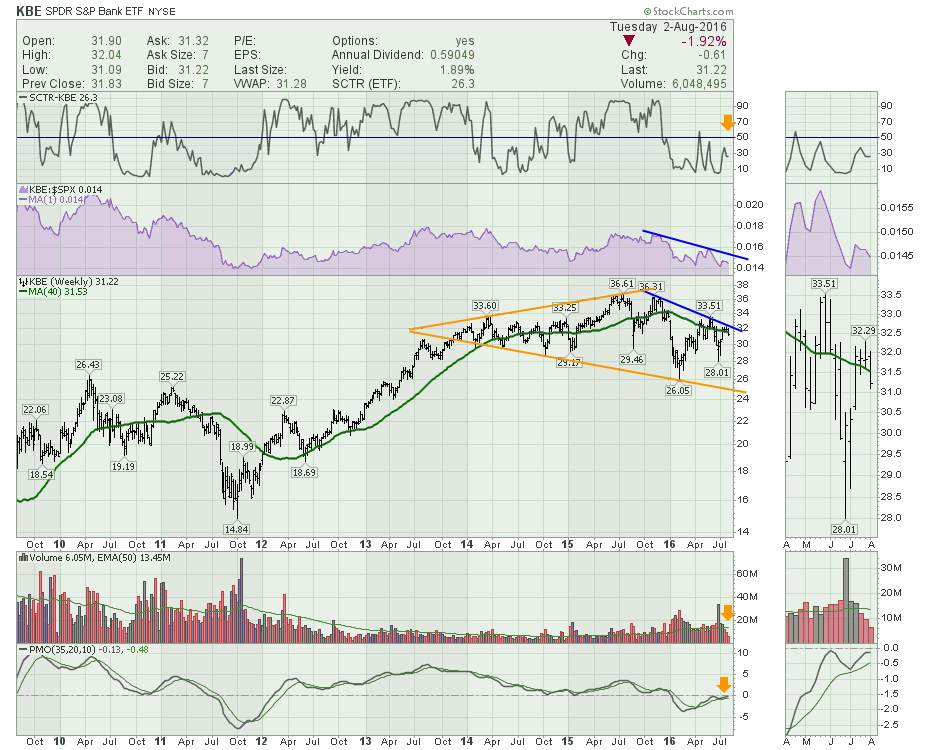
The actual price action in the ETF contains technical patterns on many fronts. First of all, we have the expanding or broadening wedge in orange. This is usually a sign of indecision. That looks to be playing out with the lower low in January and the continued trend of lower highs shown in blue. The fact that the ETF stalled at the 200 DMA and a lower high after rallying off the Brexit low suggests some awareness of the weakening situation in these financial stocks could be important.
A slightly more bullish interpretation is the higher low in June compared to February.
The volume has been very low for the last two weeks so we need to watch closely. Lastly, the StockCharts PMO is trying to get back above zero. This is a considerable level to be aware of. The weekly chart does not spend a lot of time in negative territory. Should it fail to rally above zero, we should be prepared for more negative price action.
The area between a higher low (roughly 29, and the declining highs) is the battleground. I continue to think the US is okay on its own, but the weakness in European banks and the reluctance of the market to respond positively to the situation in Japan could exert pressure in the USA. This same situation happened in 2011. So the verdict is still out, but the inability to rally through resistance over three weeks, suggests this move higher could be failing here.
This should be a very important August to see if the banks can start to rally above the previous highs. Stay tuned and Don't Ignore This Chart!
Good trading,
Greg Schnell, CMT, MFTA.
