The Dow did something strange and wonderful today on its intraday chart:
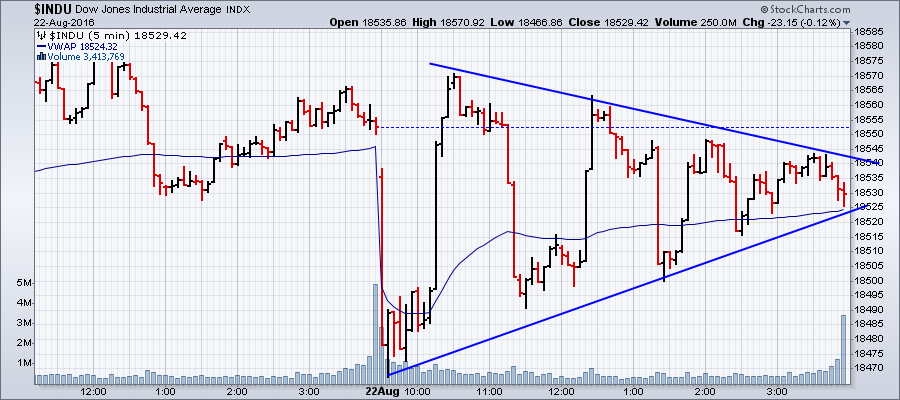 A perfect symmetric triangle pattern! But one with really strange jumps up and down throughout. Truly fascinating. Usually Symmetric Triangles are "Continuation" patterns, which typically break in the direction of the trend prior to their formation. But the Dow has been moving sideways for several days now so I'm not sure what this would be a continuation of.
More generally, Triangle patterns (also called "Coils") show that there is a big disagreement between the bulls (the lower uptrend) and the bears (the downtrend). Symmetric Triangles indicate that both sides are evenly matched. According to the old theory, as prices get closer to the projected apex of the triangle "energy coils up" (thus the name) which ultimately results in a "big release" of that energy upwards or downward. The closer prices get to the apex, the bigger the jump.
Again, that's all "in theory." And it's a pretty old theory at that - straight out of William Jiler's 1962 book! But a fascinating theory none-the-less.
Regardless, it's the big jumps that happened today at fairly regular intervals without corresponding volume spikes that caught my eye. Similar patterns happened for other major US indexes as well. Very strange indeed.
I can't wait to see what happens tomorrow.
- Chip
