McDonalds shareholders are certainly not "lovin it" right now because the stock is in a long-term downtrend and it is one of the worst performing stocks in the Dow Industrials. The chart below shows the 50-day SMA below the 200-day SMA and the stock below the 200-day SMA. The breakdown started with a lower high in mid June and a big gap down. The stock then consolidated with a triangle and is breaking the triangle trend line today. More after the jump.
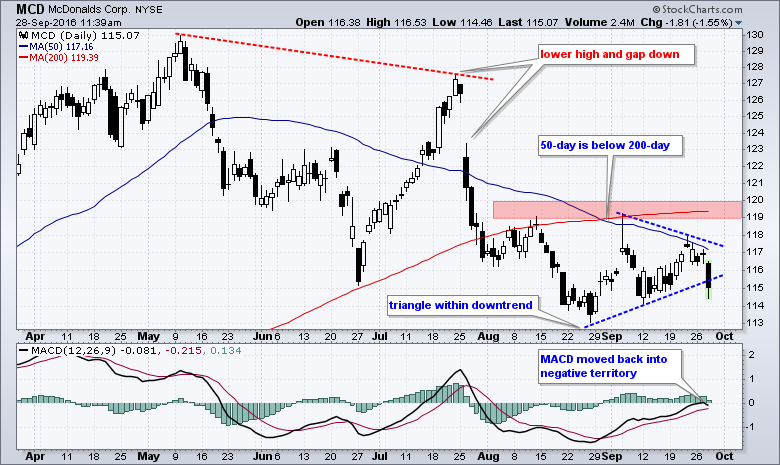
A small triangle is considered a continuation pattern and the prior move was clearly down. This makes the triangle a bearish continuation pattern. Today's break looks like confirmation and chartists can set key resistance in the 119-120 area. The indicator window shows MACD edging into positive territory on Monday-Tuesday and moving back into negative territory today. It also looks like momentum is turning down.
****************************************
Thanks for tuning in and have a great day!
--Arthur Hill CMT
Plan your Trade and Trade your Plan
*****************************************
