The Retail SPDR (XRT) is at its moment-of-truth with a long-term bullish pattern battling a short-term bearish pattern. Long-term, the ETF formed a double bottom and broke resistance with the July surge. This breakout zone turned into support with a successful test in early August. After a sharp decline from late August to early September, the ETF formed a flat consolidation near this support zone. Technically, a consolidation after a sharp decline is a bearish continuation pattern. Thus, we have the bullish double bottom breakout battling the potentially bearish flag. More after the jump....
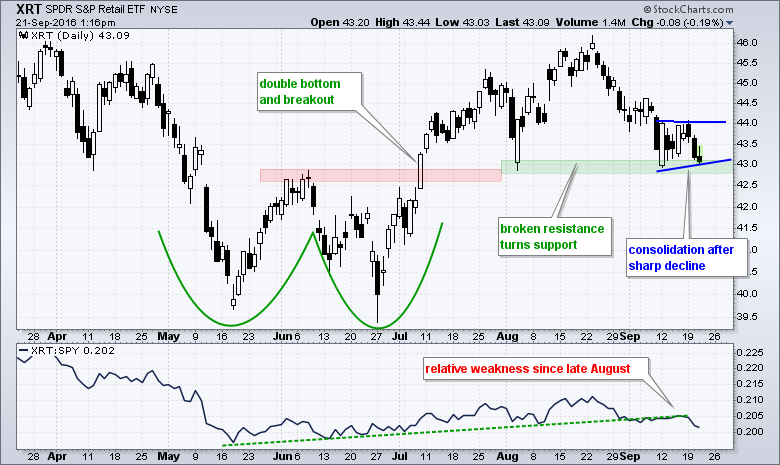
Usually, the long-term pattern carries more weight, but I am concerned with relative weakness over the last several weeks. Notice that the price relative (XRT:SPY ratio) rose from mid May to mid August and then turned down. The short-term flag is the first pattern to watch for a resolution here. A break below 43 would confirm the flag and negate the double bottom breakout. A successful test of support and upside breakout at 44 would keep the double bottom alive.
****************************************
Thanks for tuning in and have a great day!
--Arthur Hill CMT
Plan your Trade and Trade your Plan
*****************************************
