The Industrial Sector (XLI) SCTR has gone from top to bottom in the last few months. One of the reasons this is a little concerning is when the SCTR for the XLI dropped into the bottom quadrant in 2015, it marked a 6-month struggle for the index and the sector.The industrials are a good economic gauge of the economic activity and the chart suggests this is getting quite weak.
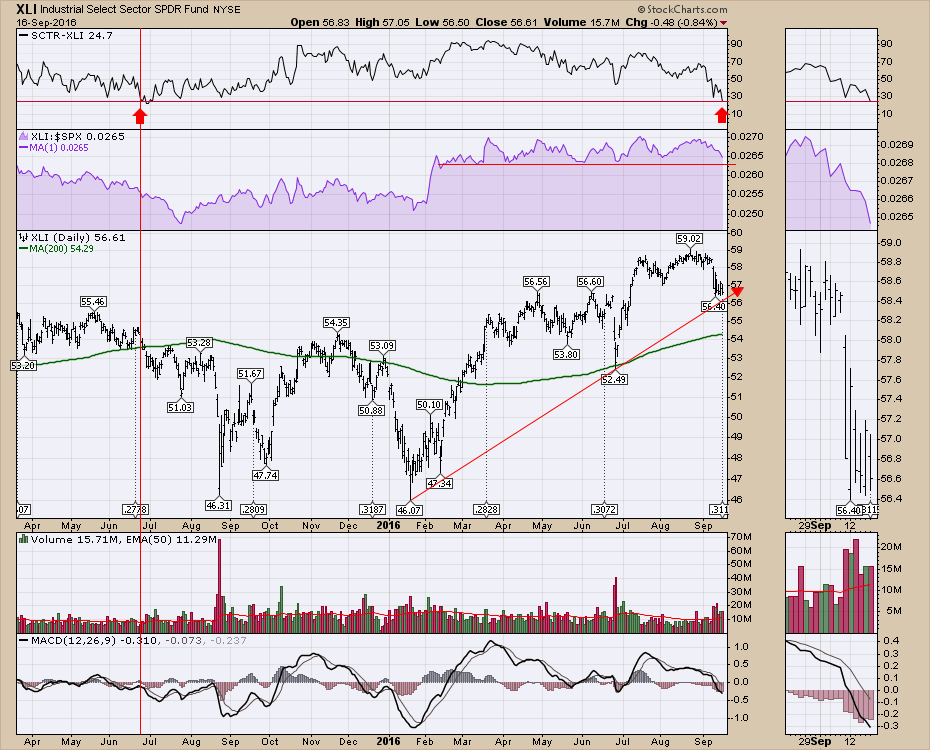 One the left-hand side, we can see where the XLI broke down last year and how poorly the ETF performed after that. At this point it is cautionary, but this is very weak.
Friday, September 23, Chartcon 2016 is coming to you via live stream broadcast! Rather than have customers spend all the money to travel to the event, we have arranged for all the technicians to gather in one location and broadcast from there, saving you thousands of dollars. It should be a fantastic couple of days with a tight synopsis of the markets from an award winning Technical Analyst crew. You can register for this event for under $200 and have access to the recordings. Chartcon 2016.
On another note, I will be presenting in person at Golden Gate University in September if you are in the area.
September 20th, 2016 @ 4 PM
Golden Gate University. Rm 3214
536 Mission Street
San Francisco, 94104
Cost: Registration is $10 for MTA members and $20 for non-members
You can register through the TSAA-SF website. Click here.
If you would like to receive future articles by email, click on the Yes button below. I do roughly one-two articles a week from each blog (Commodities Countdown, The Canadian Technician, Don't Ignore This Chart) so you need to subscribe to each one individually. I also do a couple of webinars each week and you can view those live or in our webinar archives. As a heads up, I'm on twitter @Schnellinvestor.
Thanks for taking the time to join me.
Good trading,
Greg Schnell, CMT, MFTA
PS. Chartcon 2016, Register Here!
