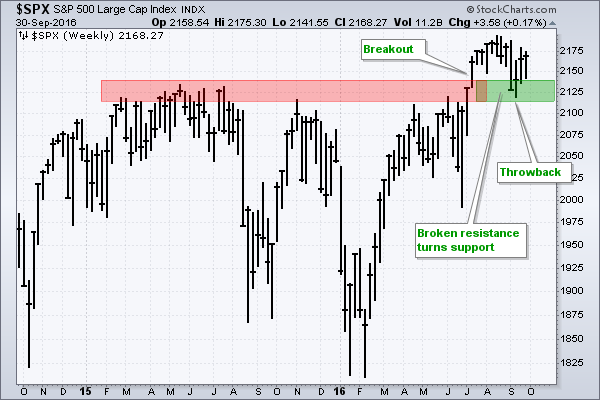
The S&P 500 broke above a big resistance zone with the July surge and this breakout should be considered bullish until proven otherwise. Classic technical analysis teaches us that broken resistance turns into the first support level and this is exactly what happened in September. Notice how the index fell back in early September and tested the broken resistance zone. This breakout test is known as a "throwback". Throwbacks offer traders a second chance to partake in a breakout because prices return to the scene of the crime. With the index bouncing off this zone over the last two weeks, we can consider this a successful test of the breakout. At the very least, this bounce reinforces support in the 2110-2140 area and provides a validation level. I will maintain my bullish outlook as long as 2110 holds on a weekly closing basis.
 ****************************************
Thanks for tuning in and have a great day!
--Arthur Hill CMT
Plan your Trade and Trade your Plan
*****************************************
