The bond market has been selling off considerably. Now the TLT is sitting at horizontal support and touching the 200 MA. This is an important place to expect support for a trade to the long side. The risk / reward ratio can be very good by having a stop just under these levels. If TLT can not hold up here, this would mark a significant long-term trend change as it would trade below the 200 DMA.
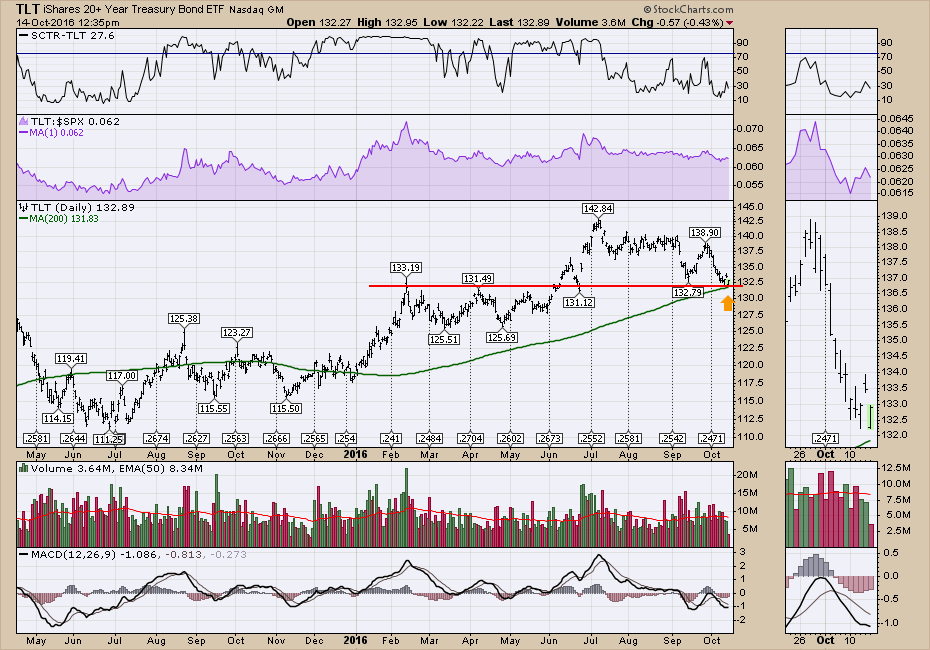
I like trading stocks and ETF's with strong SCTR's. This does not have that setup currently. At this point, this is a pattern-based trade at support. As long as this trades north of the 200 DMA this would be a continuation trade. Should support fail, this would be a significant trend change for the bond market. With so many trend lines breaking on different asset classes, watch this trade carefully for more clues in the intermarket puzzle.
I presented a very detailed intermarket picture on the webinar yesterday including indexes. Commodities Countdown 2016-10-13 Webinar. Click on the link for a high level skim and the links into the actual webinar recording. I would encourage you to check out the webinar. There are lots of changing trends right now.
Have a good weekend,
Greg Schnell, CMT, MFTA.
