Despite relative weakness the last few weeks, XLK remains in a clear uptrend and shows no signs of weakness on the price chart. First, note that XLK recorded 52-week highs throughout 2016 and is currently less than 2% from a new high. Second, XLK held the September low when the market swooned and SPY broke its September low. Third, XLK is showing signs of life with a surge off the support zone at 46.
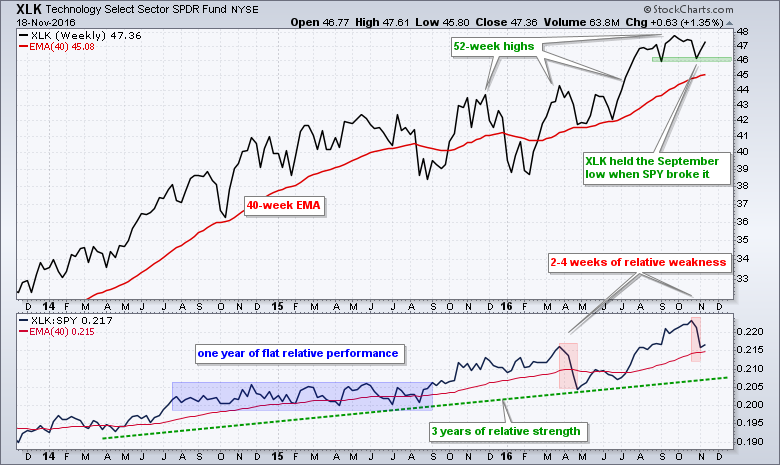
The lower window shows the price relative, which is the XLK:SPY ratio. Overall, XLK outperformed SPY for over three years because this ratio rose. The blue rectangle shows a long period of flat relative performance because the ratio moved sideways. The red areas show short and sharp pullbacks in April 2016 and October 2016. I would not read to much into the most recent pullback because the overall trend is clear up and this is the dominant force at work.
****************************************
Thanks for tuning in and have a great day!
--Arthur Hill CMT
Plan your Trade and Trade your Plan
*****************************************
