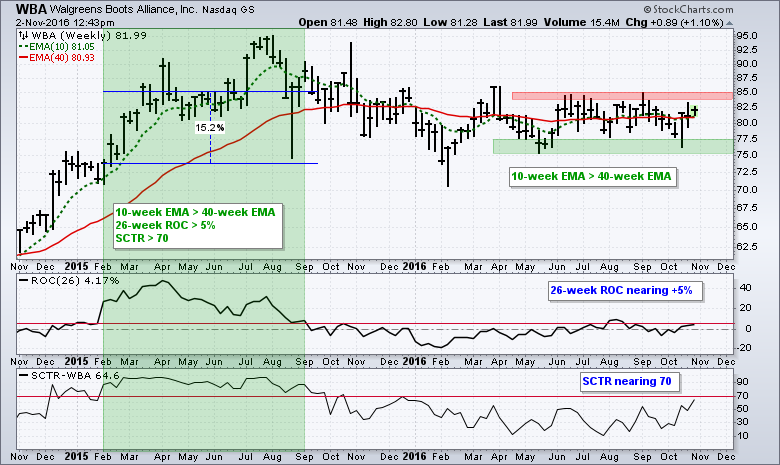
It's been a rough five weeks for the broader market, but a few stocks and groups are still shining. The S&P 500 SPDR (SPY) is down around 2.5% and eight of nine sectors are down since the end of September. The Finance SPDR (XLF) is the only sector showing a gain. Chartists looking for stocks or groups showing relative strength simply need to find the ones with a gain over the last five weeks. This is part of the reason why Walgreens Boots Alliance (WBA) came across my radar. The stock is up around 2.5% since September 30th and showing relative strength the last five weeks. The chart below shows the 10-week EMA above the 40-week EMA, the 26-week Rate-of-Change nearing +5% and the SCTR nearing 70. The green area on the left shows the last time these three indicators were in sync (trend, momentum and relative strength). On the price chart, the stock remains stuck in a consolidation and a breakout at 85 would open the door to further gains.
 ****************************************
Thanks for tuning in and have a great day!
--Arthur Hill CMT
Plan your Trade and Trade your Plan
****************************************
