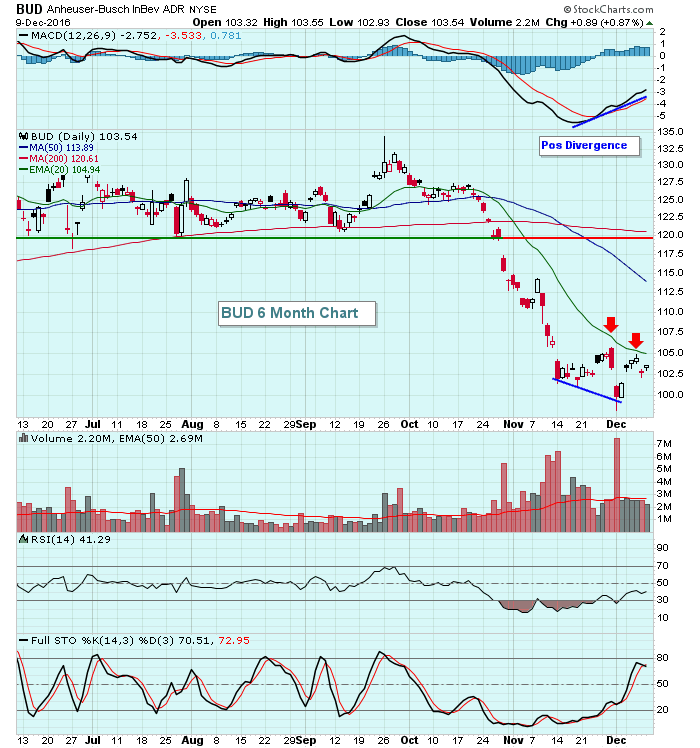
The U.S. stock market has been flying high over the past month, but shares of Anheuser-Busch InBev (BUD) have fallen close to 30% since reaching an all-time high in late September. Technically, there's hope that BUD is at or approaching a very significant bottom, however. Let's take a look at a shorter-term daily chart and then a longer-term weekly chart:
Shorter-term:
 Longer-term:
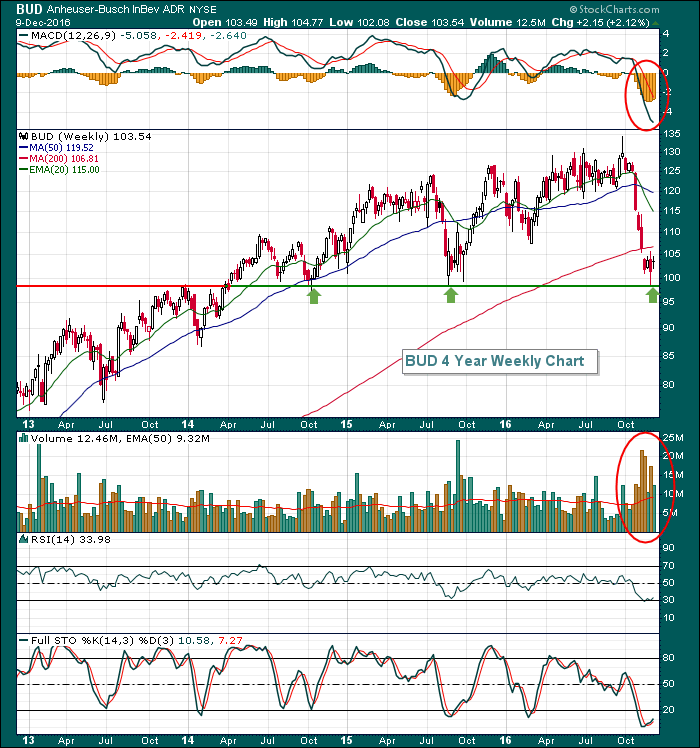 The daily chart now reflects a slowing of selling momentum, at least in terms of price action. This slowing is also occurring at a key price support level near 100 on the longer-term weekly chart. While it would be reasonable to assume that BUD is preparing to reverse at the current level, I'd be very cautious if the longer-term support level does not hold. Why? Because volume on this recent selling has been massive and weekly momentum is extremely bearish (red circles).
Happy trading!
Tom
