NVIDIA Corp (NVDA) has been one of the best performers of 2016, nearly quadrupling during the year. Its long-term chart has been phenomenal, but its weekly RSI and stochastic have been overbought since early May. That's a very long time of outperformance and a rest is not only likely, but also necessary technically. In a trending stock like NVDA with strong mometum, I look to 20 week EMA for key support. Because of the parabolic rise in NVDA shares, the 20 week EMA currently resides at 80.92. But the shorter-term bearish signal was provided on Wednesday. Take a look:
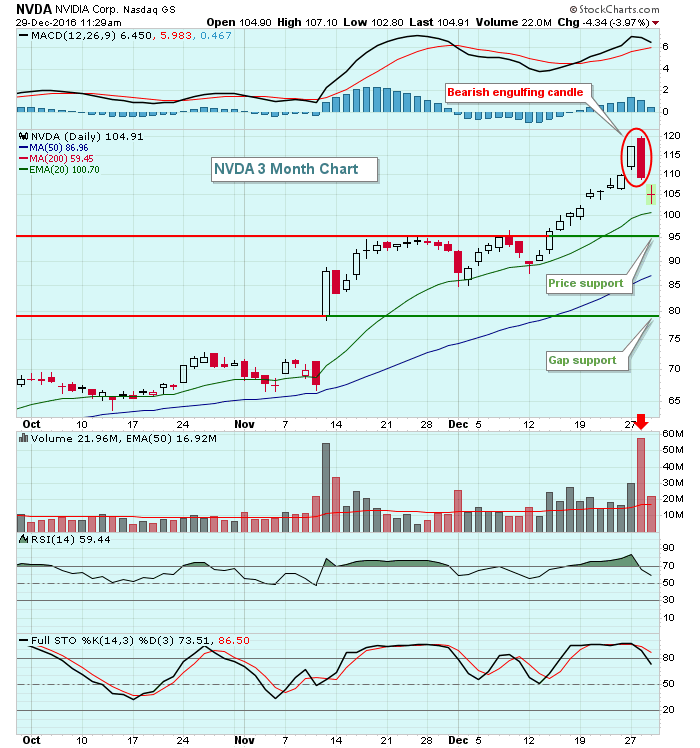 That heavy volume reversing candle cannot be ignored. Wednesday's open near 120 now becomes very significant price resistance while the three key support levels will be an upcoming 20 day EMA test just above 100, followed by price support and gap support near 95 and 79, respectively. I'd expect at least an initial bounce off the rising 20 day EMA. Volatility is likely to be substantial on NVDA over the next several days as panic sets in from buyers near 120.
Happy trading!
Tom
