 The Relative Rotation Graph above holds a number of (world) equity indices compared to the FTSE all world index as the benchmark, using daily data. For those of you who are following my regular RRG blog, this means a shorter-term view than you are used to from me.
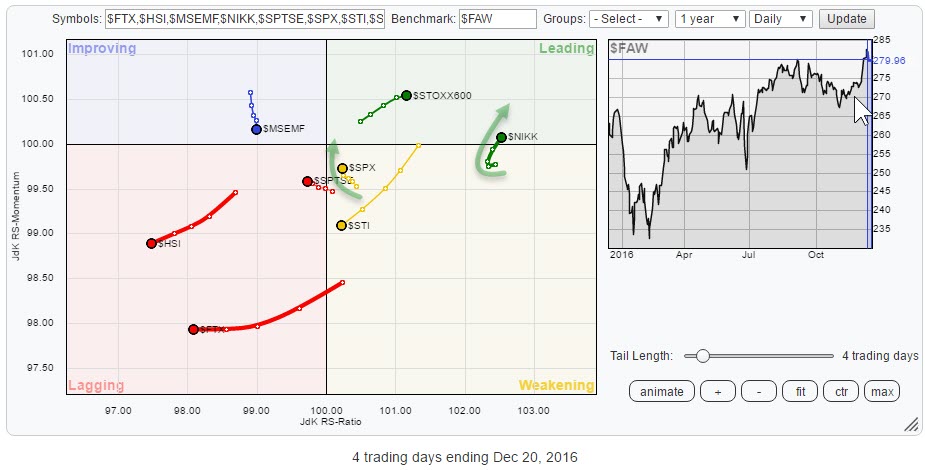
The rotations that stand out in a negative way are the stock markets of Hong Kong $HSI), China ($FTX) inside the lagging quadrant, and Singapore ($STI) which is still inside the weakening quadrant but rapidly approaching a crossover into lagging, backed by a long (=strong) tail.
From research, we know that tails that turn towards a N-NE (0-90 degrees on a compass) heading while INSIDE the weakening quadrant, usually trigger strong moves.
This type of move took place or is taking place for two markets; the US ($SPX index) and Japan ($NIKK index). Both seem poised to show strong relative strength in coming days based on this rotational pattern.
Because $NIKK is (much) higher on the JdK RS-Ratio scale it looks to be a more mature (less risky) trade than $SPX which is still close to the 100 level, hence a slight preference for Japan over the US for the time being.
The rotation for $SPX is definitely worth keeping an eye on as it is in the early stages of this relative move, which means that it has more potential left which comes associated with a bit of extra risk. When $SPX continues its current rotation and crosses over into the leading quadrant, that should not be ignored.
The RRG chart above has a permalink to the live version of the chart so you can come back and check the rotation or save the RRG as a bookmark in your own browser to monitor it on a regular basis.
Julius de Kempenaer | RRG Research
RRG, Relative Rotation Graphs, JdK RS-Ratio and JdK RS-Momentum are registered TradeMarks by RRG Research
Follow RRG Research on social media:
