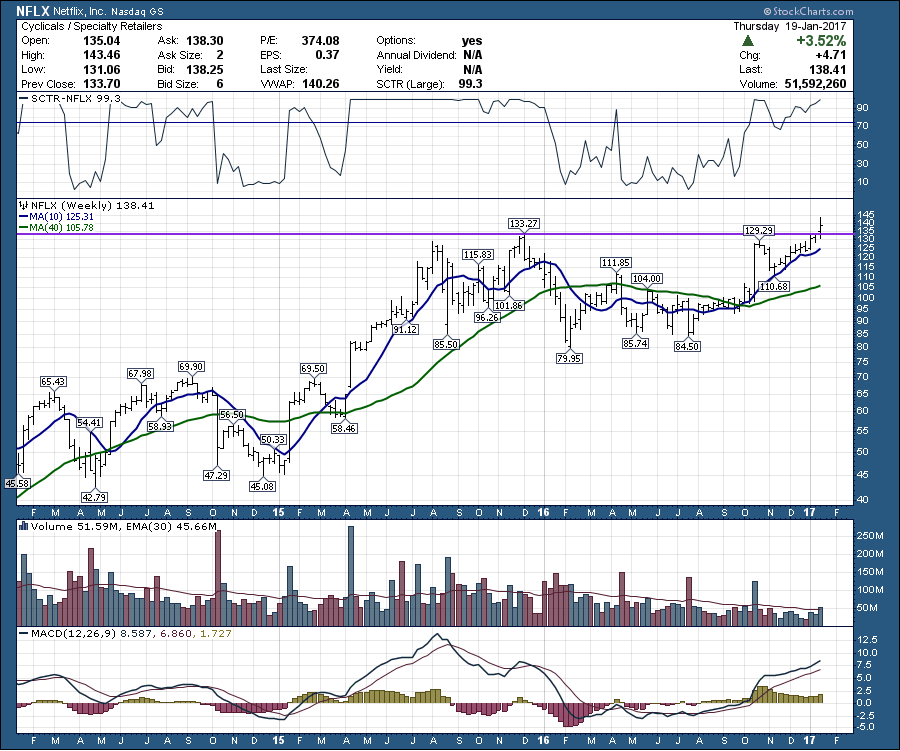
Netflix continues to deliver content to homes and profits to investors. After reporting good numbers vs. expectations, Netflix popped up to new highs. It wasn't all scrolling credits for the company as the stock sold off continuously on Thursday after the huge gap to new highs. This is a weekly chart that looks good as long as the stock holds the breakout above $130.
The weekly chart does not show todays selling, so I'll use a 1-month chart of 60-Minute candles. Considering the good report, there were a lot of sellers taking profits.
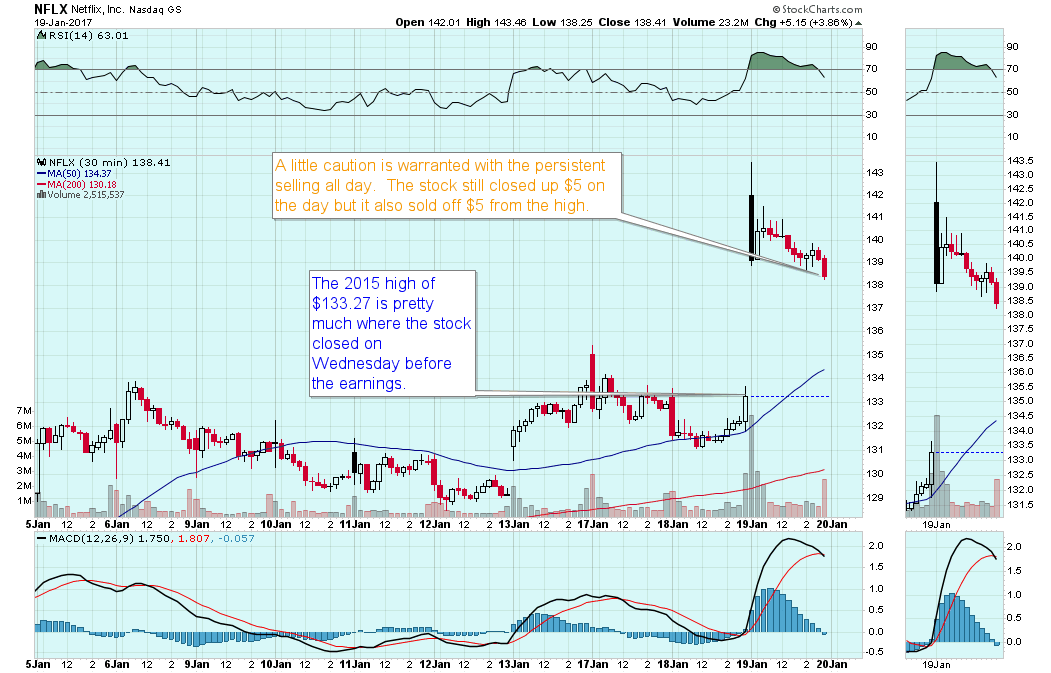 In the short term this might be overdone. We also have more volatility from Options Expiration on Friday. While the stock still looks great, there are short term reasons to be cautious.
Good trading,
Greg Schnell, CMT, MFTA.
