Don't Ignore This Chart! February 28, 2017 at 10:45 AM

Biotech's have been working their way higher over the past few months and the Technical Analysts at StockCharts have been documenting the breakout. This breakout shows up in a multitude of ways. Now one of the Biotech's is on the Top 10 SCTR list... Read More
Don't Ignore This Chart! February 27, 2017 at 12:15 PM
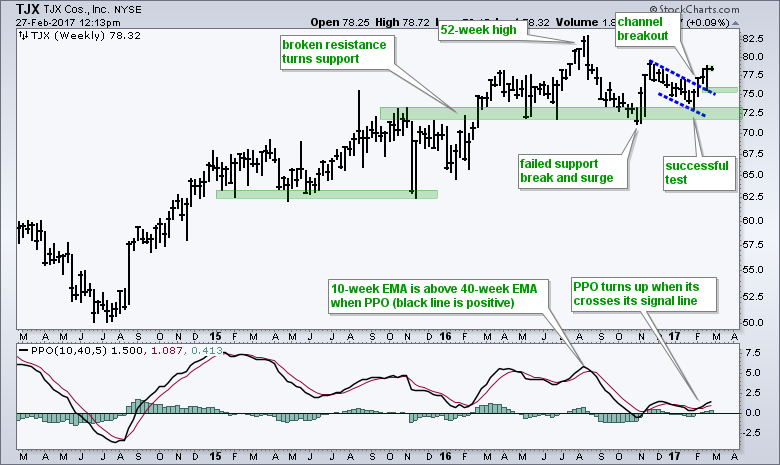
TJX Companies (TJX), which operates TJ Maxx and Marshalls, recently broke out of a corrective pattern and this argues for a continuation of the bigger uptrend. It has been a rough year for most retail stocks with the Retail SPDR (XRT) down around 1% year-to-date... Read More
Don't Ignore This Chart! February 26, 2017 at 10:05 PM
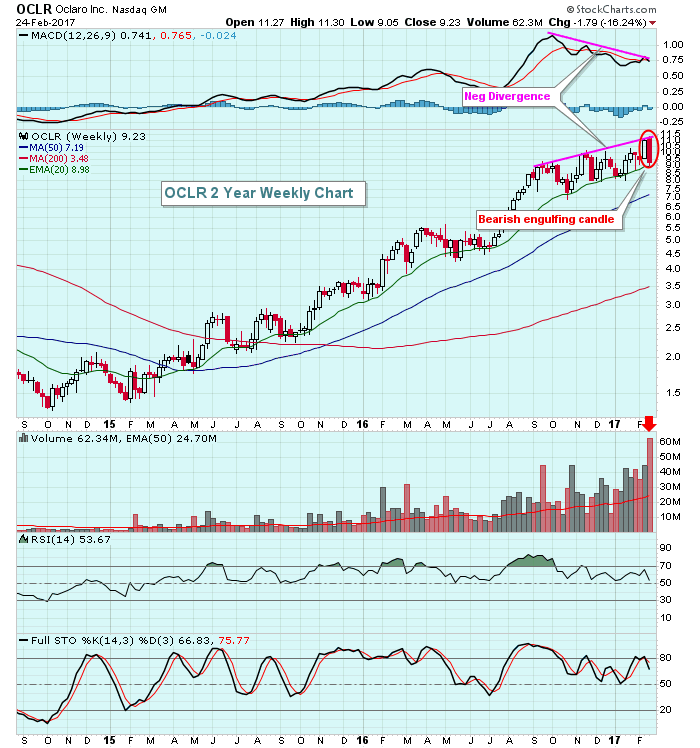
Oclaro Inc (OCLR) is printing several warning signals as it appears to be topping after a stellar advance... Read More
Don't Ignore This Chart! February 24, 2017 at 09:20 AM
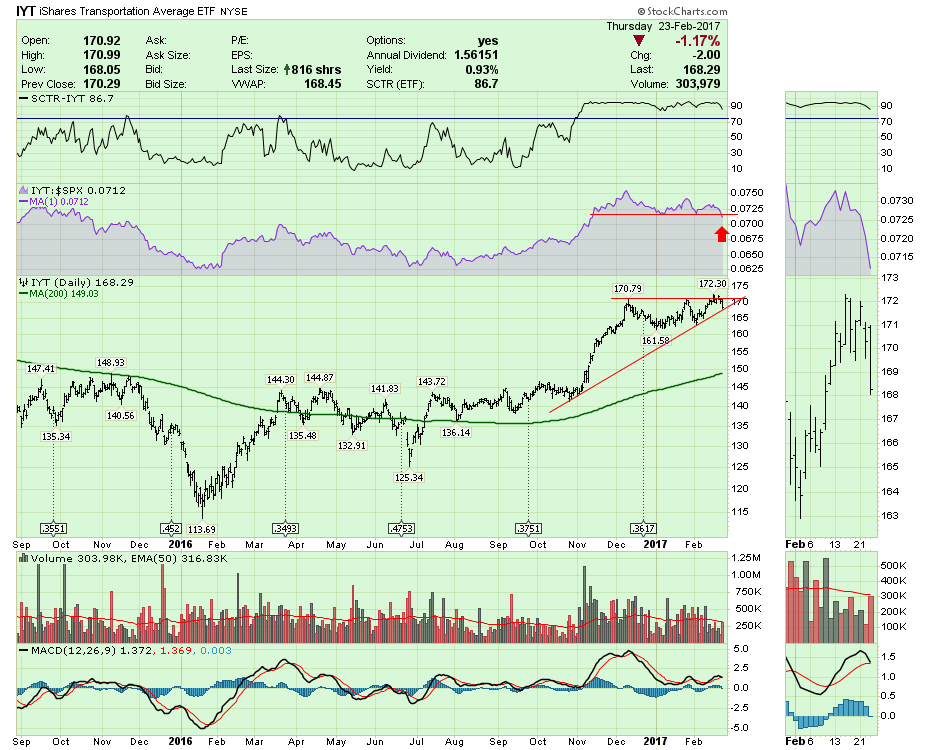
The Transportation ETF (IYT) is struggling to hold the recent breakout. The new three-month lows in Relative Strength in purple suggest being very careful with the Transportation stocks here after failing to hold the breakout above December highs... Read More
Don't Ignore This Chart! February 24, 2017 at 01:12 AM
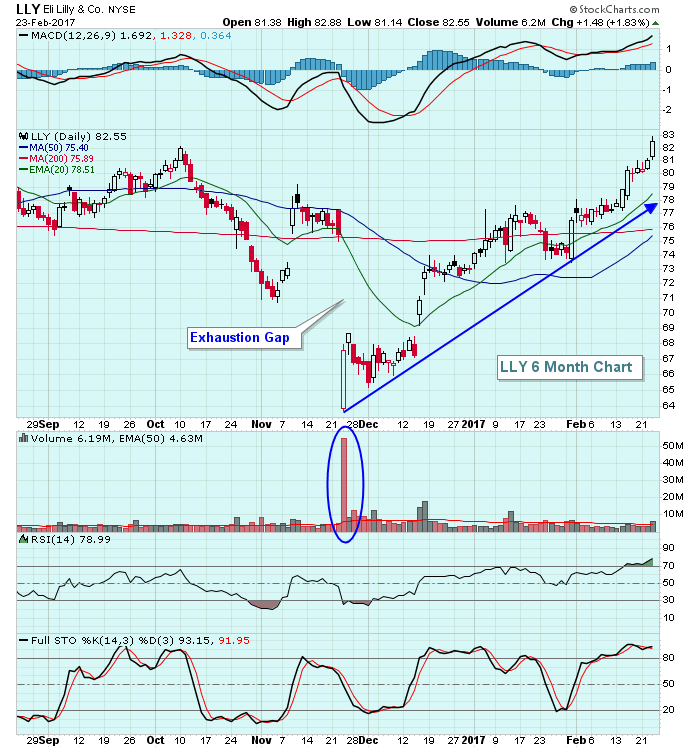
Eli Lilly (LLY) printed an exhaustion gap in November on massive volume, marking a significant bottom and over recent trading days broke a downtrend line that spanned 18 months of action... Read More
Don't Ignore This Chart! February 22, 2017 at 02:29 PM
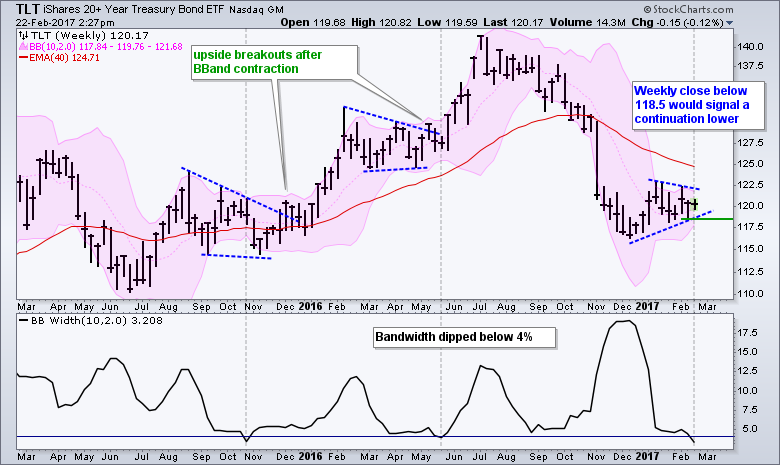
The 20+ YR T-Bond ETF (TLT) is consolidating within a long-term downtrend and this favors a bearish resolution to the current pattern. TLT fell sharply from July to November and broke through its 40-week EMA... Read More
Don't Ignore This Chart! February 21, 2017 at 11:20 AM
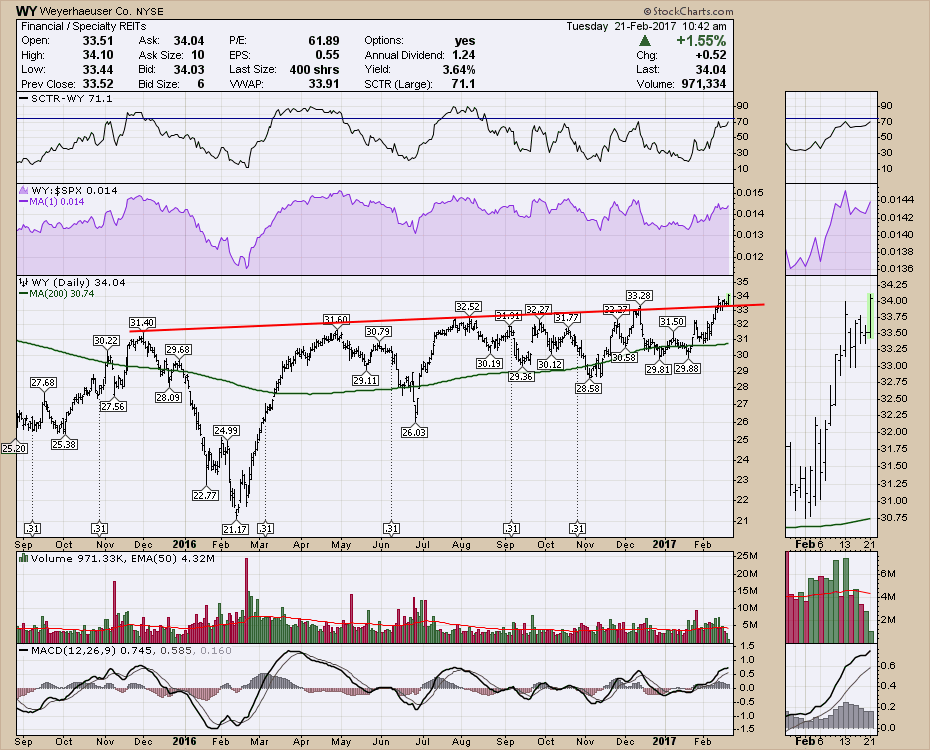
Every week on the Commodities Countdown recording, we look at lumber prices. For the last week $LUMBER has pushed up and the lumber stocks are all on a big broad push. Weyerhaeuser (WY) is pushing through the previous highs or the forest canopy if you will... Read More
Don't Ignore This Chart! February 19, 2017 at 11:27 AM
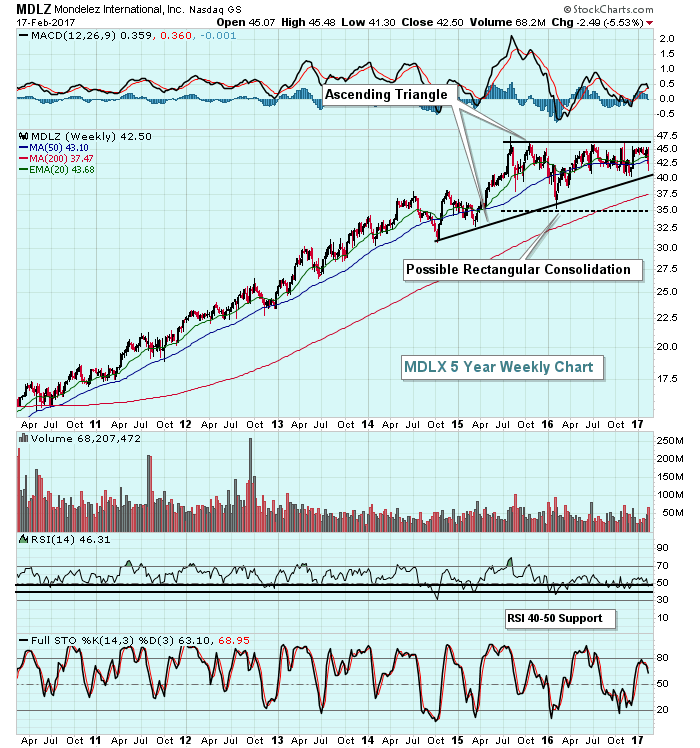
Mondelez International (MDLZ) had a rough week, tumbling over 5.5% after Kraft Heinz (KHC) made a bid for Unilever (UL). That suggested to many investors that the likelihood of a MDLZ acquisition was significantly reduced and the stock was priced lower accordingly... Read More
Don't Ignore This Chart! February 17, 2017 at 09:32 AM
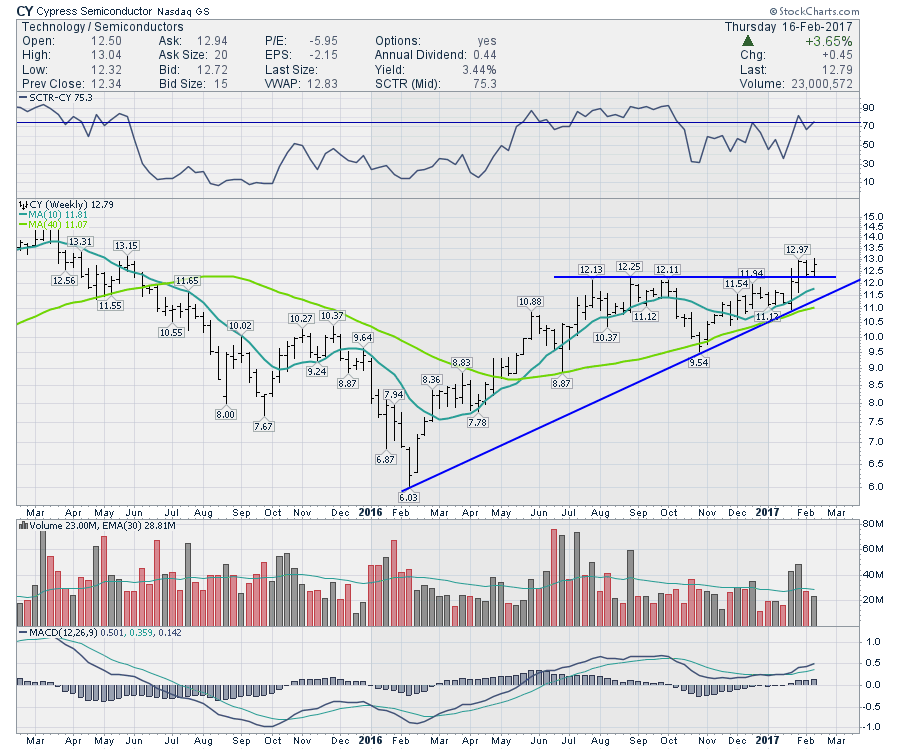
Cypress Semiconductor (CY) rallied 2 weeks ago to new 52 week highs. It is still consolidating the breakout but looks well positioned. The volume last week was very low on a pullback compared to the volume on the breakout. That is a really nice bullish sign... Read More
Don't Ignore This Chart! February 16, 2017 at 04:03 PM
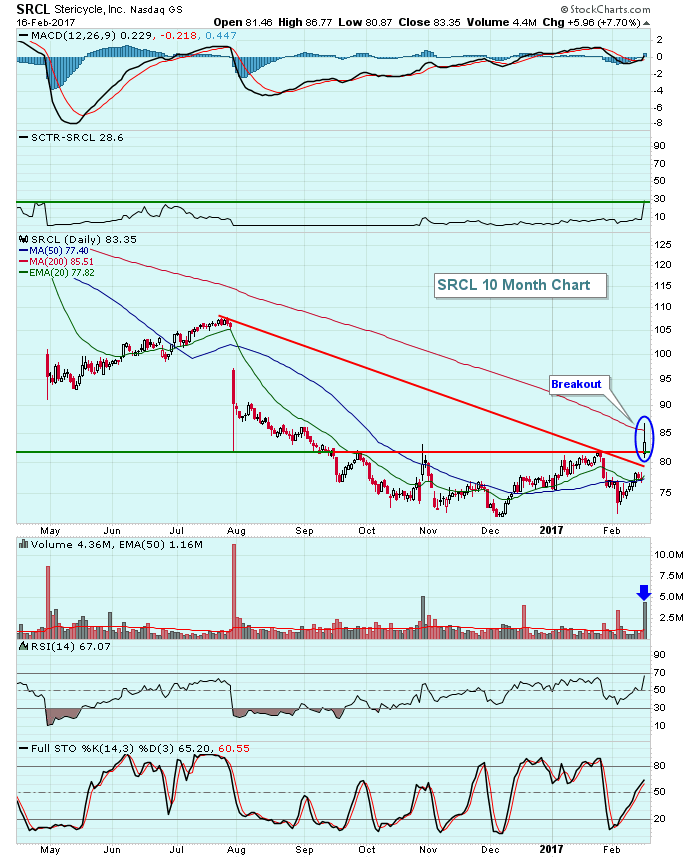
Stericycle (SRCL) has been under rather intense selling pressure over the past 16 months, losing half its market cap. The waste management company disappointed Wall Street on several occasions and we've seen major gap downs on heavy volume three times over those 16 months... Read More
Don't Ignore This Chart! February 15, 2017 at 11:57 AM

Walgreens Boots Alliance (WBA) has traded quite choppy over the last 12 months, but I think the bigger trend is up and the recent wedge breakout is bullish. First, notice that WBA broke above a major resistance zone with the November-December surge... Read More
Don't Ignore This Chart! February 14, 2017 at 04:20 PM
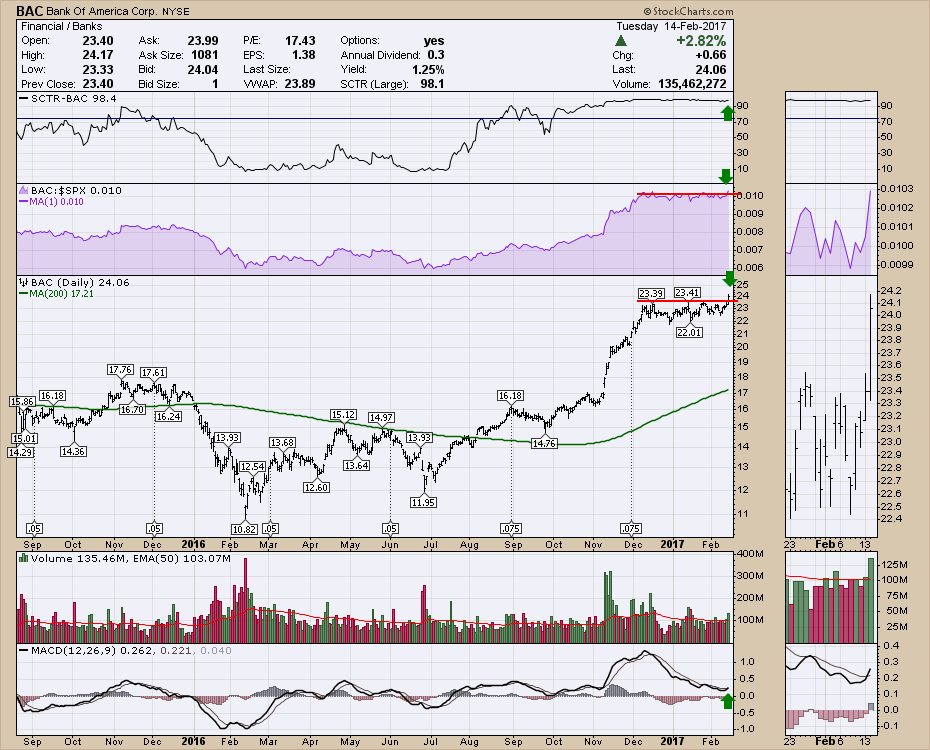
Bank of America (BAC) has been consolidating recently. Today that consolidation ended as BAC made a big bull push out of the consolidation pattern. With a strong SCTR, this was on the radar anyway. Click on this link to understand more about what the SCTR is... Read More
Don't Ignore This Chart! February 13, 2017 at 11:05 AM
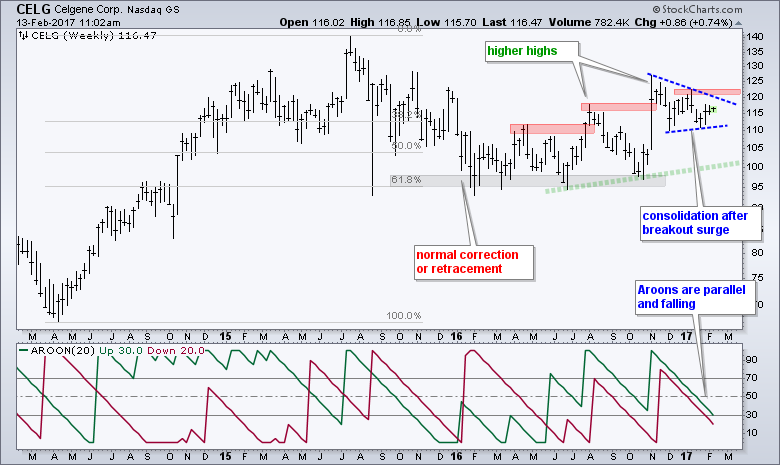
Celgene (CELG) has not made much headway the last twelve months, but the overall trend is up and the current consolidation looks like a bullish continuation pattern. Taking a step back, notice that CELG doubled from the April 2014 low to the July 2015 high (~70 to ~140)... Read More
Don't Ignore This Chart! February 11, 2017 at 03:38 PM
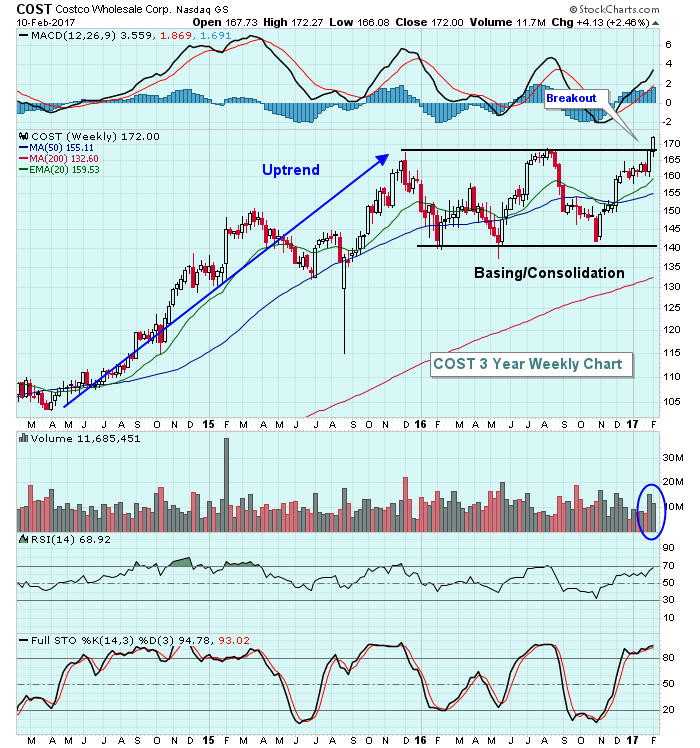
After long basing periods, breakouts can be very significant technical events that lead to powerful gains. Those invested in or trading Costco (COST) are hoping last week's breakout signals a nice advance in the months ahead... Read More
Don't Ignore This Chart! February 10, 2017 at 09:58 AM
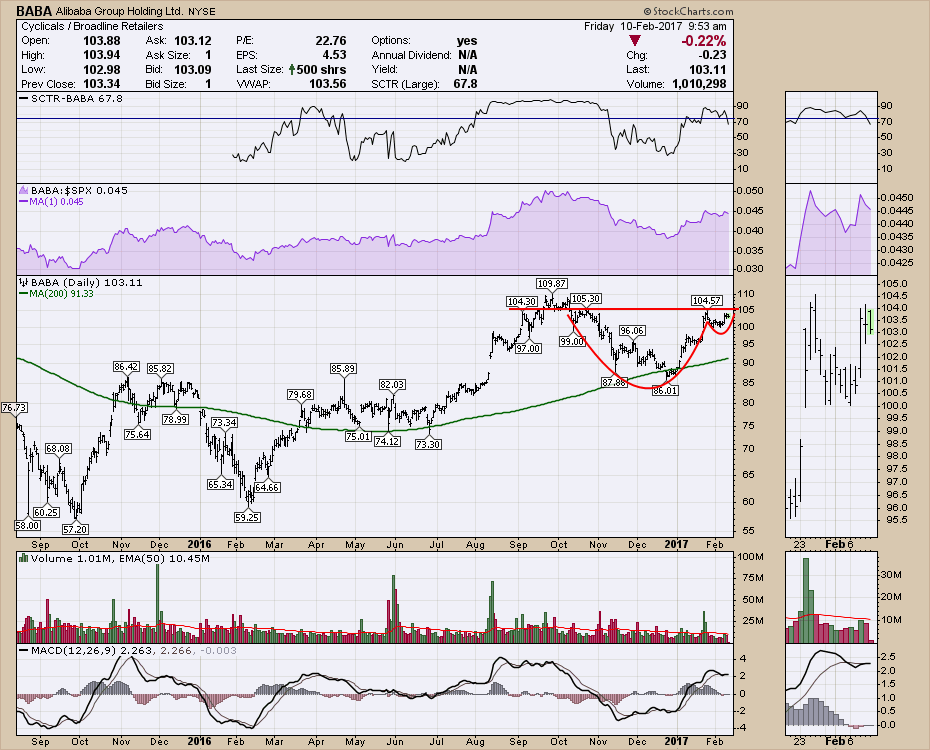
Alibaba (BABA) has been building a consolidation pattern recently. After pulling back for four months, BABA started to turned higher. In the zoom box you can see the gap up on earnings. Now the stock is trying to break through the top of the cup and handle setup at $104.57... Read More
Don't Ignore This Chart! February 09, 2017 at 04:54 PM
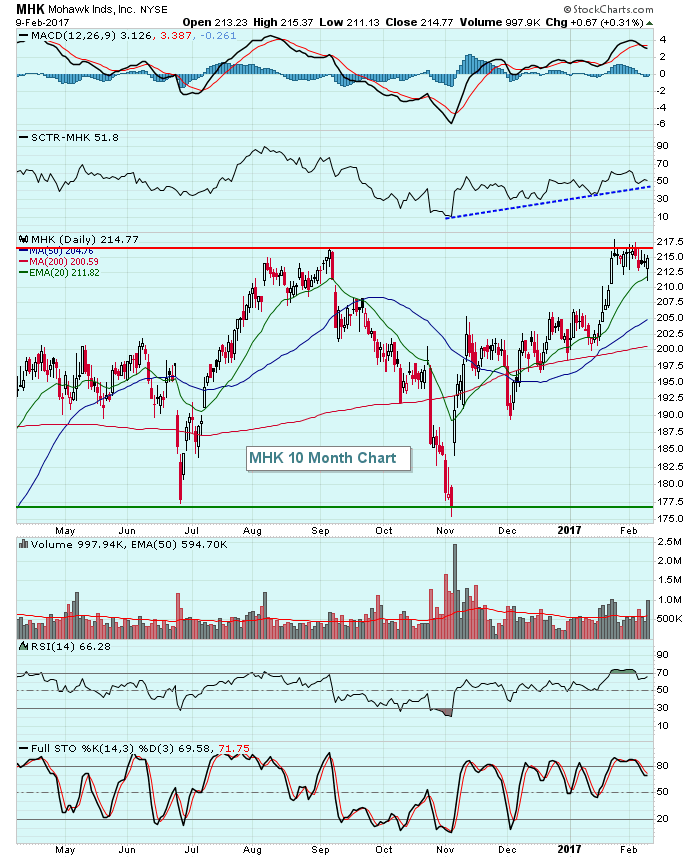
Mohawk Industries (MHK), a flooring designer and manufacturer, just reported quarterly earnings that exceeded Wall Street consensus estimates... Read More
Don't Ignore This Chart! February 08, 2017 at 11:09 AM
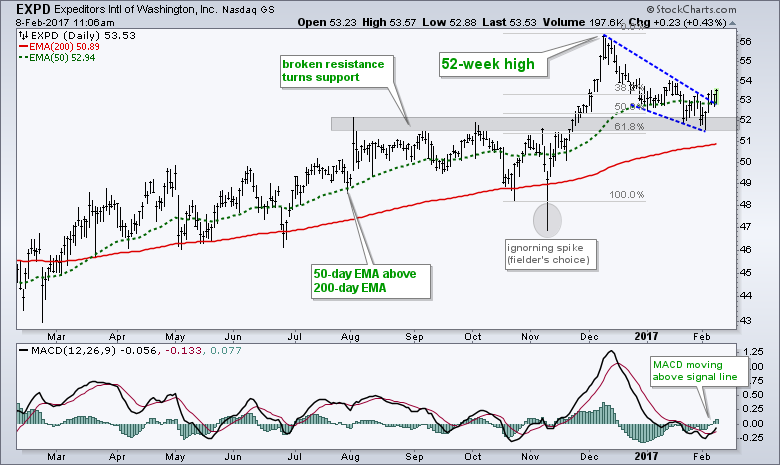
Expeditors International of Washington (EXPD), a logistics services provider, is part of the Dow Transports and the Industrials SPDR. The stock caught my eye because it is in a long-term uptrend and recently pulled back to a potential reversal zone... Read More
Don't Ignore This Chart! February 08, 2017 at 09:15 AM
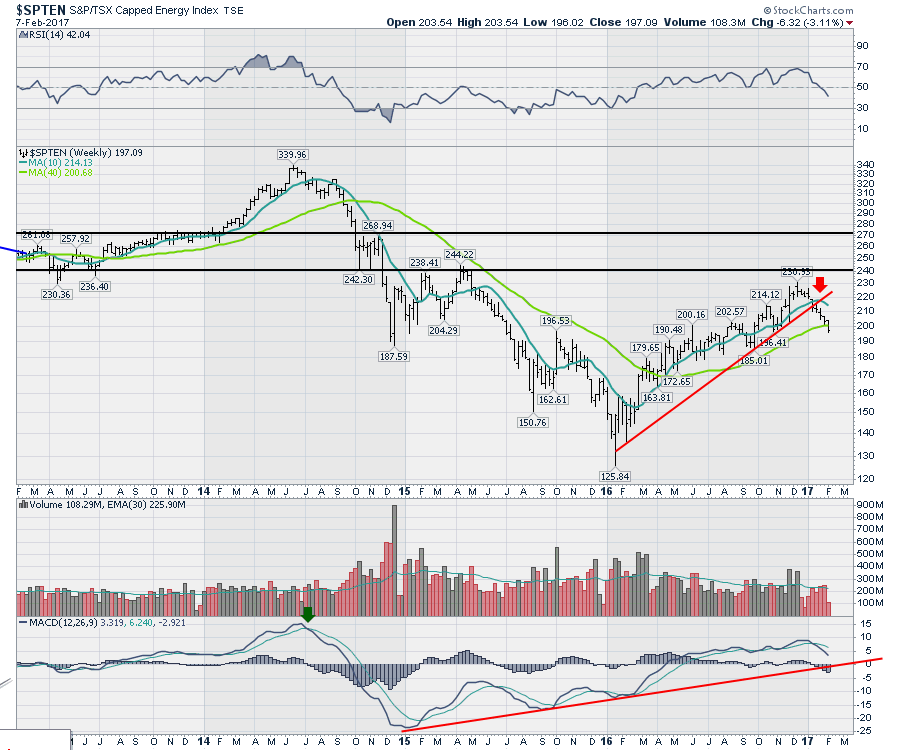
I spent the webinar discussing the Canadian sectors as well as working with parabolic surges. The Energy chart is broken. The real question is does it get support here around the 40 WMA? The Canadian Industrials are still trying to hold their trend line... Read More
Don't Ignore This Chart! February 07, 2017 at 03:31 PM
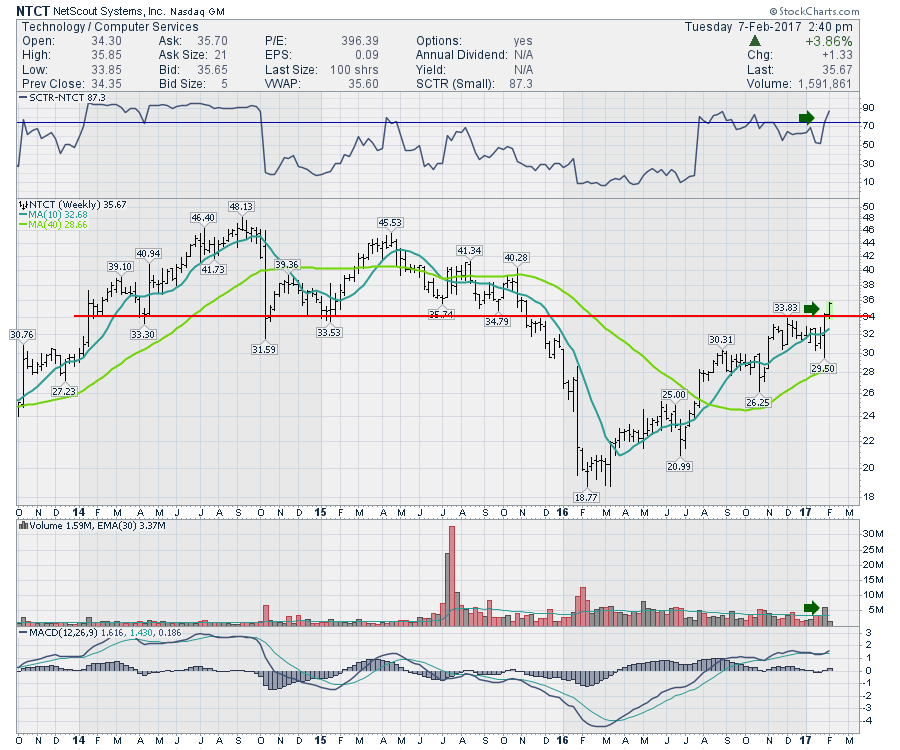
NetScout has been climbing for a while but a few months ago stalled at resistance. The price action this week pushed the chart through resistance. The volume last week was well above average and the price action this week looks to confirm the action... Read More
Don't Ignore This Chart! February 06, 2017 at 11:36 AM
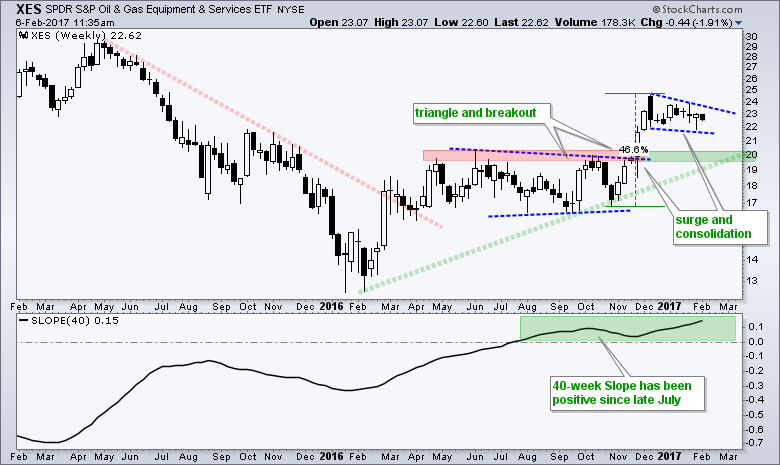
The Oil & Gas Equipment & Services SPDR (XES) surged to 52-week highs in November and early December. It is clear after this surge that the bigger trend is up. First, the 40-week Slope turned positive in late July and remains positive... Read More
Don't Ignore This Chart! February 03, 2017 at 09:53 AM
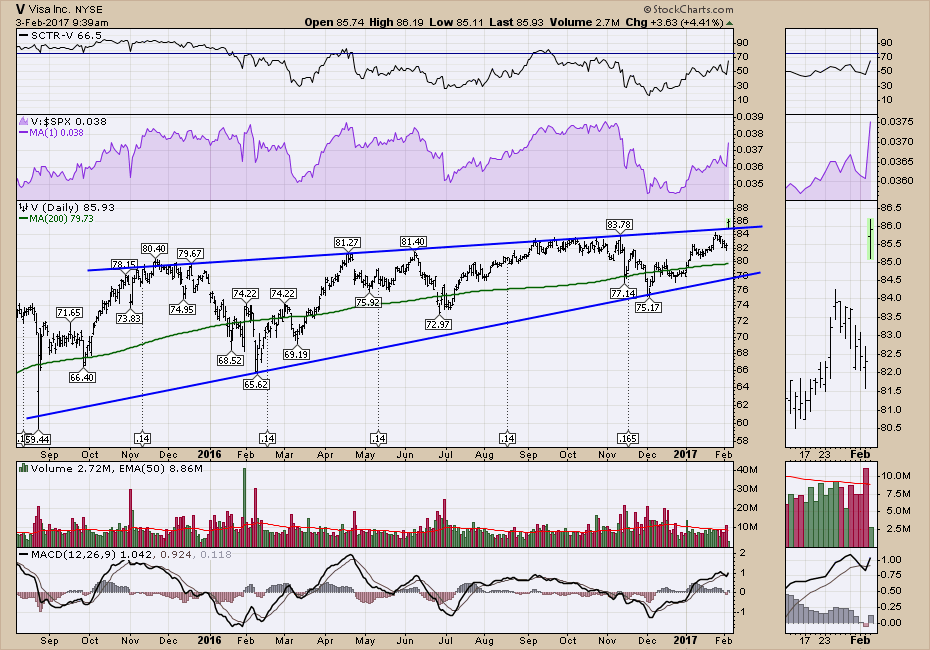
Visa has been trapped below $84 for a while. There has been a slight upslope on the highs but they were all within 5% of the high in November 2015. Today, Visa popped well above the previous highs. The stock has been consolidating around this $80 +/- $4... Read More
Don't Ignore This Chart! February 02, 2017 at 05:41 PM
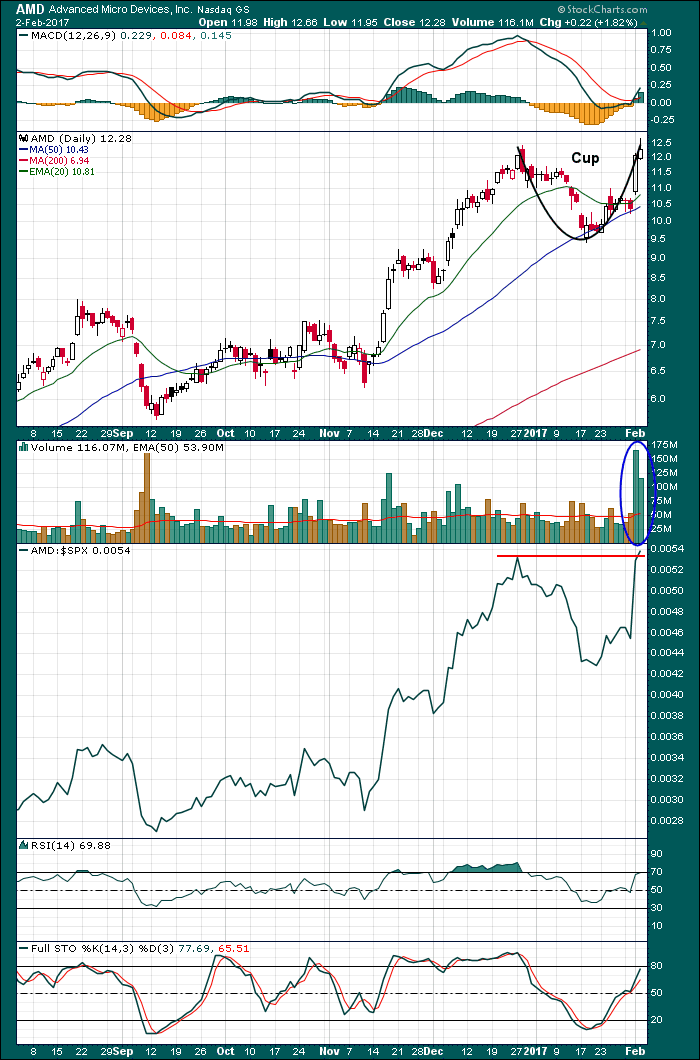
Advanced Micro Devices (AMD) was one of the best performing stocks in 2016 and the bullish pattern that's printed in the first five weeks of 2017 suggests the rally hasn't ended just yet... Read More
Don't Ignore This Chart! February 01, 2017 at 11:44 AM
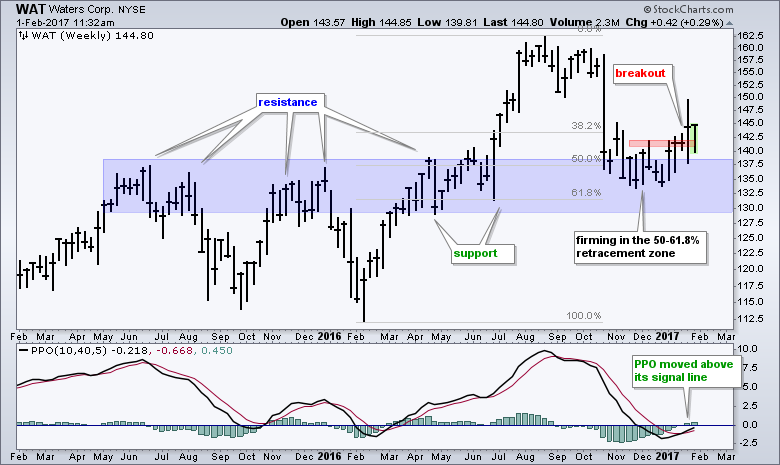
Waters Corp (WAT) was hit hard with a double-digit decline in October, but the stock ultimately firmed in November-December and turned up in 2017. Waters Corp is in the top 20% of S&P 500 stocks for year-to-date gain. The chart also looks rather promising... Read More