China Unicom (CHU) is a huge telecommunications company as it ranks 4th in the world for subscribers. This week it extended a breakout and pushed up to fresh new highs. The SCTR is at it's highest level in 2 years and is above 75, which I think is a big positive. The weekly MACD made a positive cross above the zero level which usually suggests a lot of momentum to go higher. The base built below the red line is exceptionally good with higher lows since last summer.
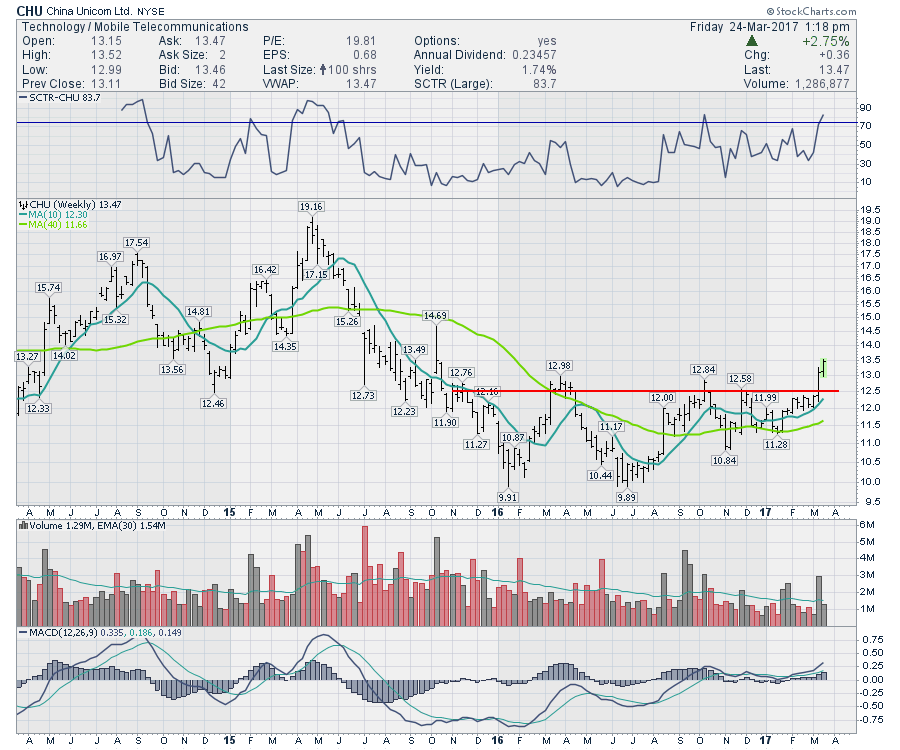 This looks like a great entry with a stop under this weeks low. It also may help diversify your portfolio.
For the educational segment, I want to discuss 'custom sizes' in chart settings. This is a very helpful setting to enable you to make your charts just right for your screen size.
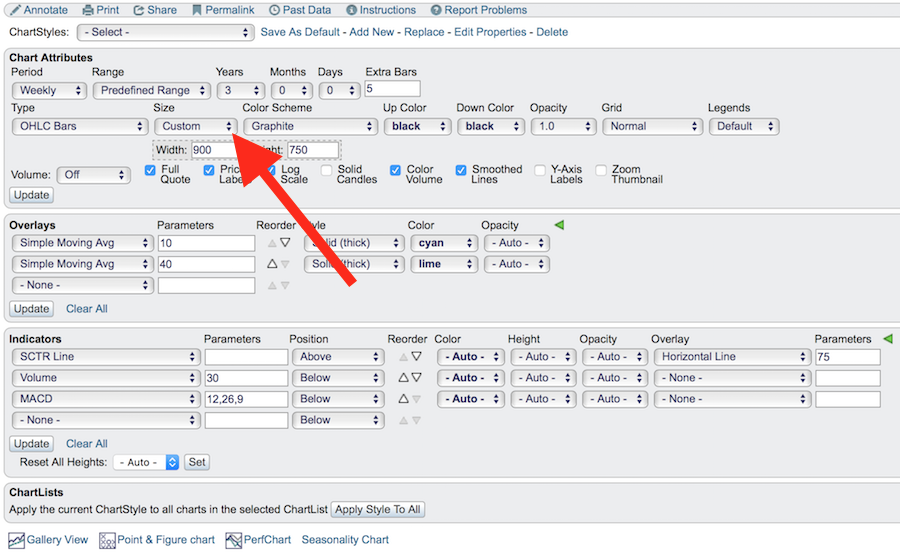 The dropdown menu provides an opportunity to select from different preset sizes. One of the options is 'Custom'.
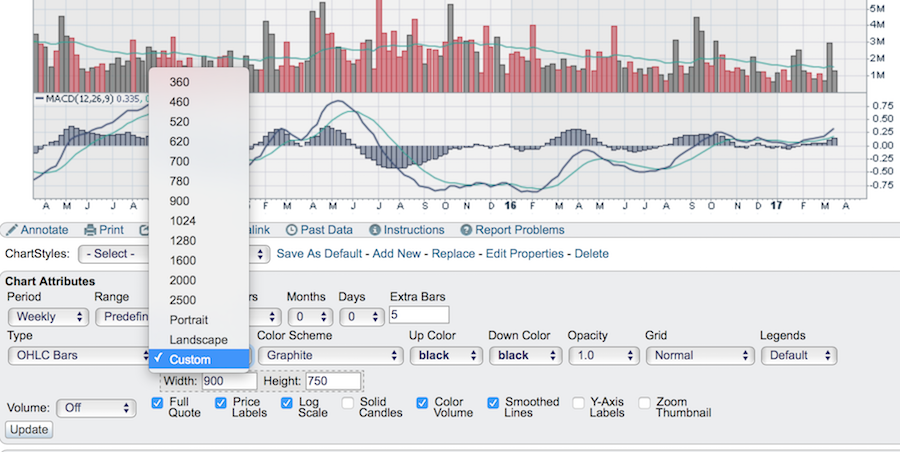 Using this setting you can adjust the width and length of your charts for specific scenarios.
I use 1250 wide by 750 high which fills the screen for doing presentations like the video recordings we post every week. For writing articles on the blogs, we have a narrower requirement and 900 pixels is our maximum. If you have the zoom box component on the right it will add onto the width measurement so I restrict the main chart width to 780. Then the format works as 780 + 120 pixels for the zoom box = 900.
The benefit of this flexibility is you can set your chart styles to be more printer friendly, or for use in a powerpoint or Keynote presentation and adjust the size of the chart for your presentation format. Your freinds and clients will really appreciate using all of the screen real estate available.
If you send newsletters to clients, you can set the chart size to fit your newsletter format. Try playing around with the different sizes. There are lots of options to help get it 'just right'.
Have a great weekend.
Good trading,
Greg Schnell, CMT, MFTA.
