Stocks got hammered on Tuesday with the S&P 500 falling the most this year (1.24%) and breaking below its March low. Even with the seemingly big decline, the index is still just 2.25% from an all time high. Darden Restaurants caught my attention because it did not break below its early March low. Instead, the stock surged the last eight days and broke a triangle trend line. Overall, DRI is in a long-term uptrend because the stock surged to new highs in November-December. After a 30% advance in just eight weeks, the stock was extended and ripe for a correction. A triangle unfolded as the stock worked off these overbought conditions the last three months.
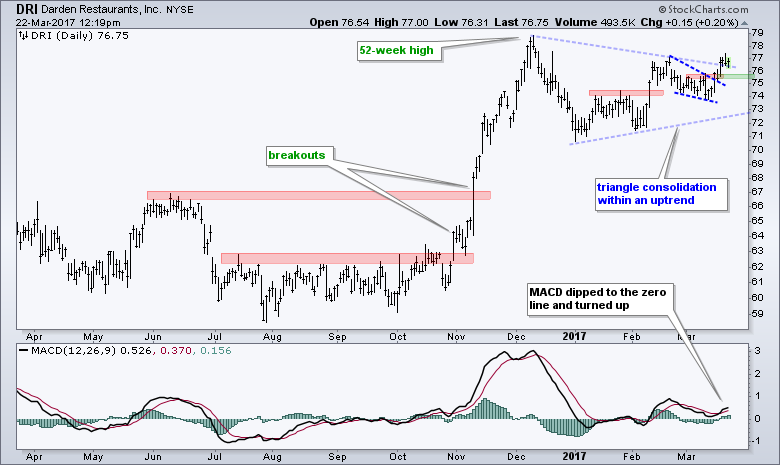
A triangle after a sharp advance is a bullish continuation pattern and a breakout would target a move to new highs. Within the triangle, there is a smaller falling wedge breakout. Notice the falling wedge is also a bullish continuation pattern and last week's breakout provided the early signal. The wedge breakout was also accompanied by an upturn in MACD. Broken resistance in the 75-76 area turns first support and I would re-evaluate my bullish stance on a close below 75.
****************************************
Thanks for tuning in and have a great day!
--Arthur Hill CMT
Plan your Trade and Trade your Plan
*****************************************
