The banks have been rocking as they have been surging since last summer. In the last few months they have paused their rally. Since they announced earnings, they have not really rallied. This week had a nice pop but the real question is can they continue? While history can be a potential guide, it is important to realize the perilous clues on the chart as they form. Whether they play out is yet to be seen, but this is a situation that shows up near tops.
Bank of America (BAC) has some concerning technical signals. Lowering momentum on the higher peak is a warning flag. Seeing that little negative divergence is always a conversation starter. However, now the MACD has gone below zero. If it rolls over under the zero line, this is a typical loss of momentum on the right shoulder of a topping pattern. While we don't know if it will follow through, this setup allows us to realize the potential for a move lower when we least expect it. Notice the MACD has slowed slightly while still below zero as you can see in the zoom box. It shows as a lower histogram.
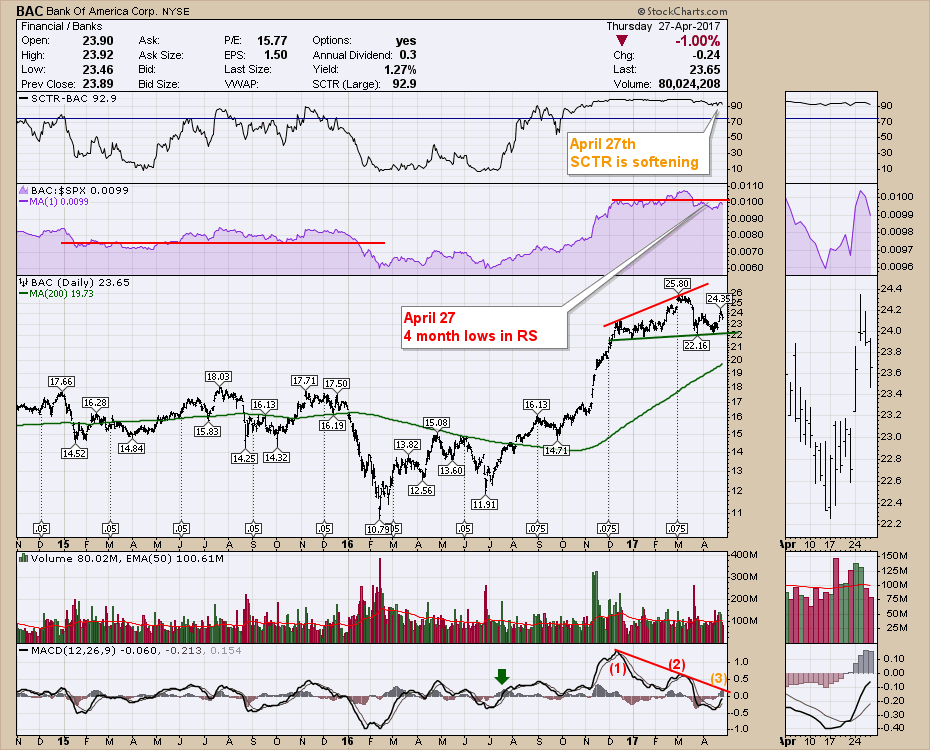
One expectation is for volume to recede on each peak. The recent volume is similar to the March 1st high. Volume is not a primary requirement, but it can be another part of the signal. I don't like the SCTR getting slightly weaker. But the bigger issue is new 4-month lows in RS. This is another thing that suggests weakness. All together, investors should be prepared for either outcome.
Here is a dramatic example. We all know how oil fell apart in 2014. There is a similar setup with the indicators on Apache back in 2014. The MACD surged to a new high in June 2014, then made a divergent high near the top. The last peak on the MACD as it fell below zero marked a final test of the highs.
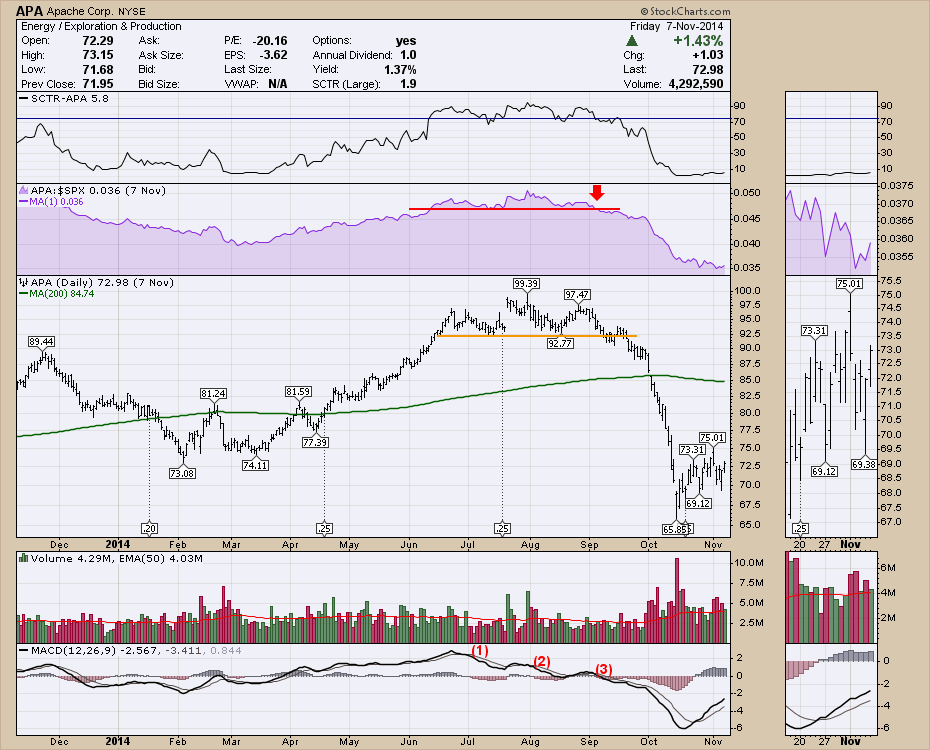 We obviously don't know if the downside will be severe, but we do have to be aware of the potential for this chart to break down. The potential for a topping pattern is in place. We need to be aware of both outcomes.
Good trading,
Greg Schnell, CMT, MFTA.
