Nike (NKE) popped up 8% this morning on earnings right at the mid point of the year. Nike accelerated straight up for 3 years before topping in 2015. After retracing 20%, the stock tried to climb and it looks like its working to take the lead.
The chart is setting up two classic patterns. The first is a breakout through a downtrending line. The second is the horizontal support/resistance area at $57.70 looks pretty important to get through. You'll also notice the blue dashed line also represents a neck line for a head and shoulders base.
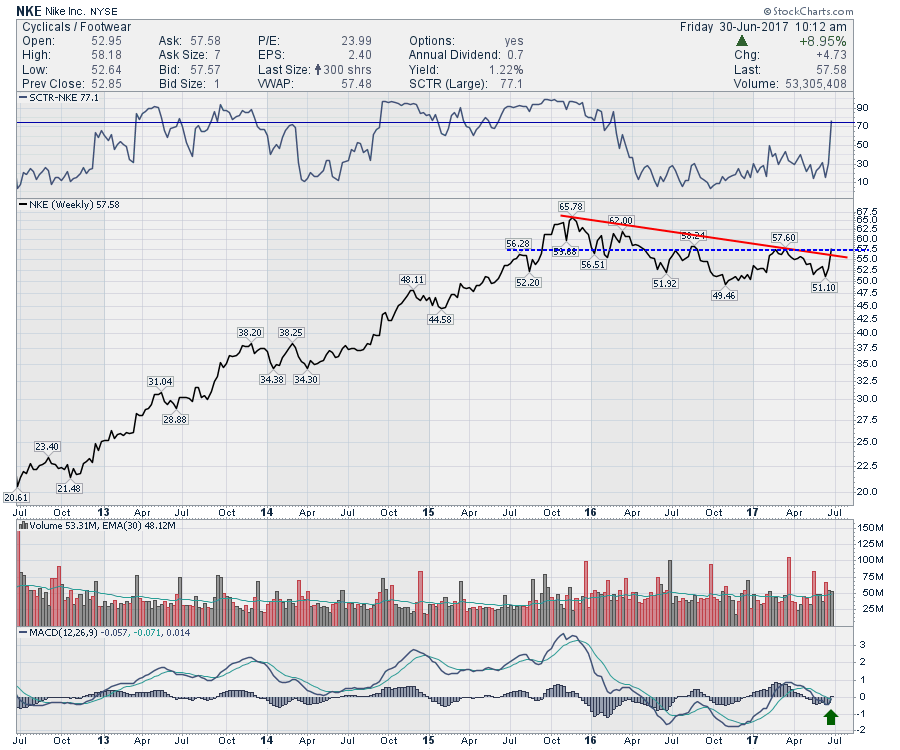 The MACD turning up after coming back to test the zero line from above is a classic setup. This looks like a nice consumer cyclicals company for the back to school and holiday shopping season.
To all the Canadians out there, Happy Canada day 150, and to all the American readers out there, Happy July 4th!
Good trading,
Greg Schnell, CMT, MFTA
