The Dow Jones U.S. Semiconductors Index ($DJUSSC) is an extremely volatile index. When this index is trending higher, there aren't too many better places to be invested. But when the fire goes out, you want to run, not walk, for the exits. So where are we now, after a month of blood-letting in the space? Should we be entering or should we be running away?
Well, first let me say that the group needed a breather, by just about any measure. From its low in mid-April, the DJUSSC gained roughly 17-18% in the next eight weeks. That's a serious move higher and it ended with the daily MACD extremely extended, daily RSI near 80 and weekly RSI in the upper-70s. That's very overbought. Also keep in mind that the DJUSSC's worst seasonal stretch is easily June through September. Now let's take a look at two key charts below - first the daily chart and then the weekly chart:
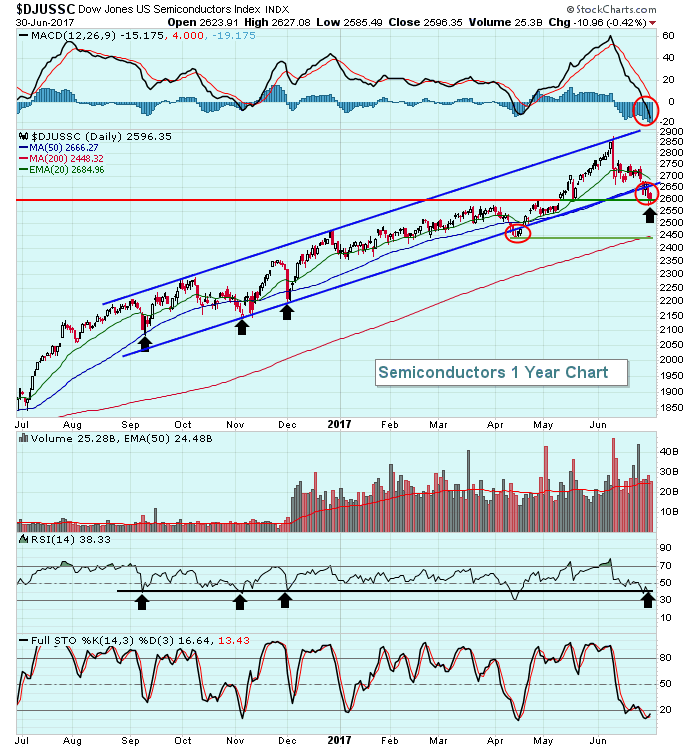
Daily:
 Weekly:
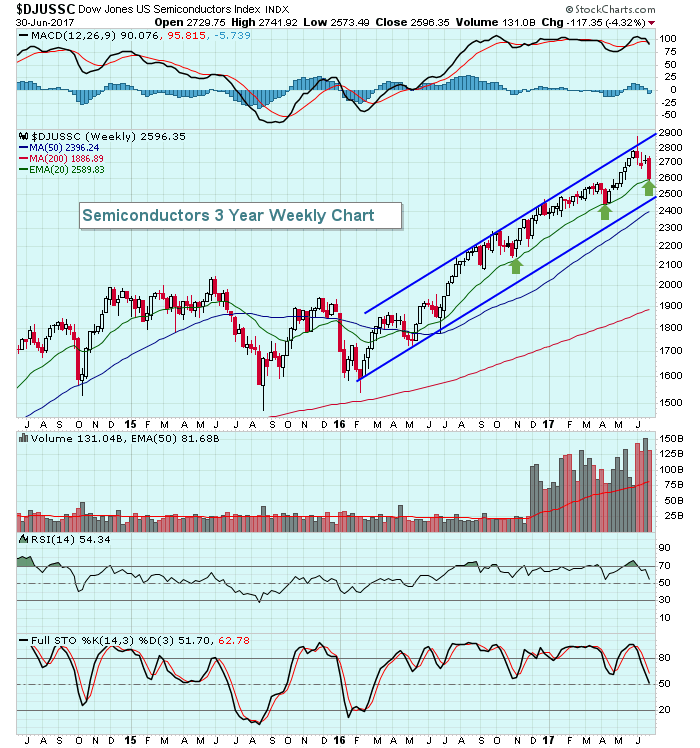 Normally, during an uptrend we see RSI 40 tests as an opportunity to enter positions. The black arrows on the daily chart show that RSI 40 tests have been excellent entry points into semiconductors. They've mostly coincided with short-term bottoms. The mid-April selling was one exception where the selling was steep enough to generate a 30 reading on the RSI. The green arrows on the weekly chart show that the 20 week EMA has also provided excellent support throughout this uptrend.
As long as price support holds, I'd be okay building positions in the semiconductors space. Just realize that you're trading an extremely volatile industry group so you need to be willing to stomach the risk that accompanies this group. The first key price support level near 2600 is being tested right now. If that level fails to hold, I would not be at all surprised to see the 2450 level tested. In my opinion, that's a much more significant price level because it's the most recent low on the weekly chart. An uptrend is nothing more than a series of higher highs and higher lows and losing 2450 would suggest the uptrend has been broken.
Happy trading!
Tom
