Don't Ignore This Chart! September 30, 2017 at 01:58 PM
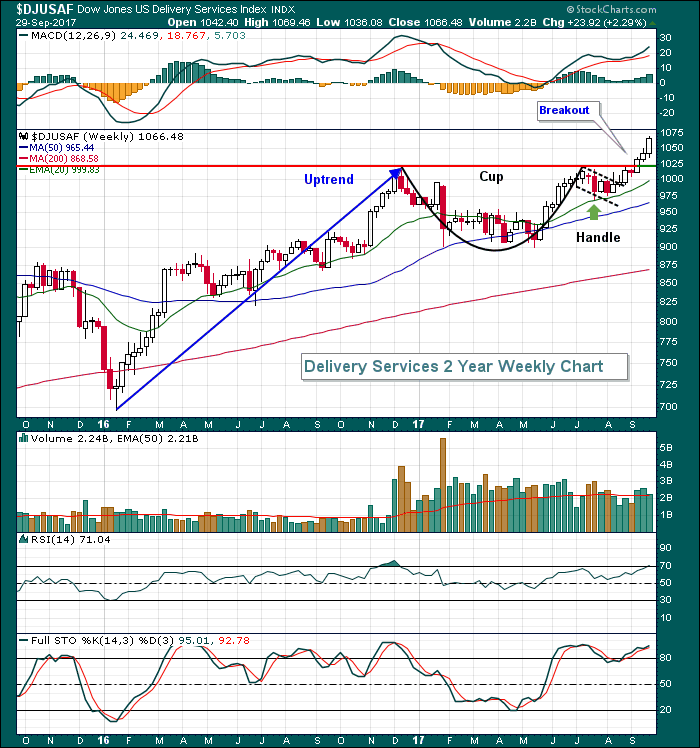
Delivery services ($DJUSAF) broke out of a bullish continuation cup with handle pattern a few weeks ago and appears poised for a further fourth quarter rally, albeit with some profit taking along the way... Read More
Don't Ignore This Chart! September 29, 2017 at 09:16 AM
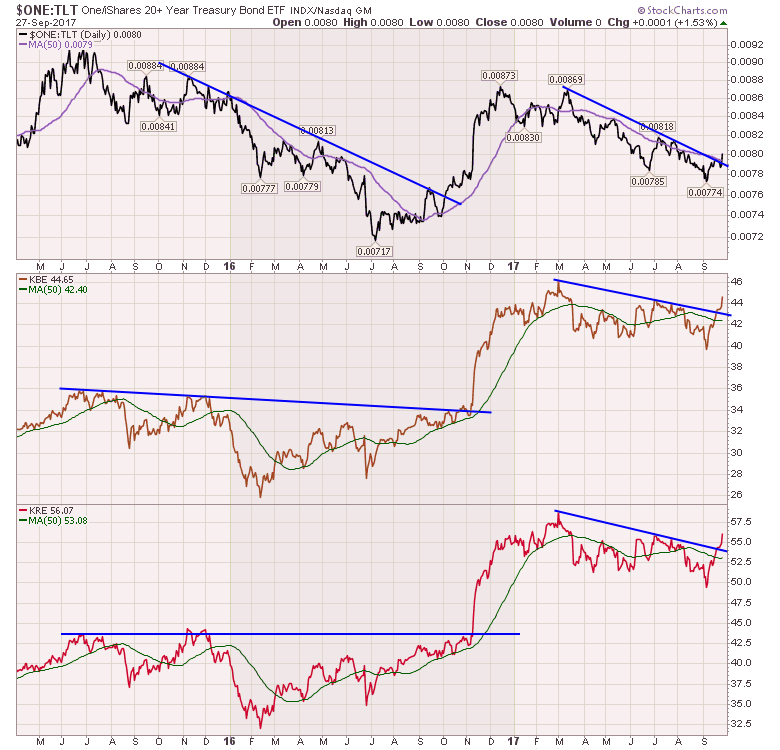
Bonds and Financials are correlated tightly. We all know that. But the trade appears to be getting set up for a fabulous fourth quarter again. This chart inverts the TLT 20 Year Bond ETF on the top panel so that it behaves the same as the financials... Read More
Don't Ignore This Chart! September 27, 2017 at 06:52 AM
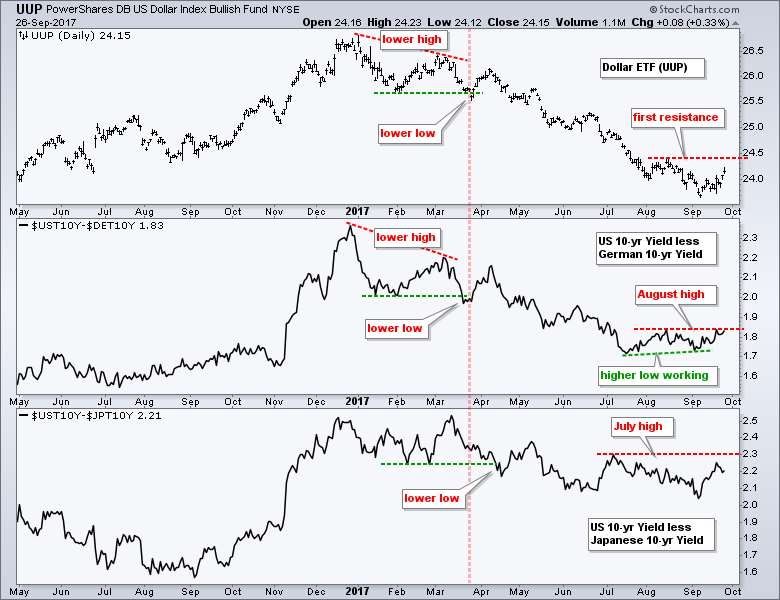
The US Dollar ETF (UUP) is made of five currency pairings. The Dollar/Euro ($USDEUR) pair accounts for 57.6%, Dollar/Yen ($USDJPY) weighs 13.6%, Dollar/Pound ($USDGBP) is 11.9%, Dollar/Canadian ($USDCD) is 9.1% and Dollar/Swiss ($USDCHF) is 3.6%... Read More
Don't Ignore This Chart! September 26, 2017 at 02:59 PM
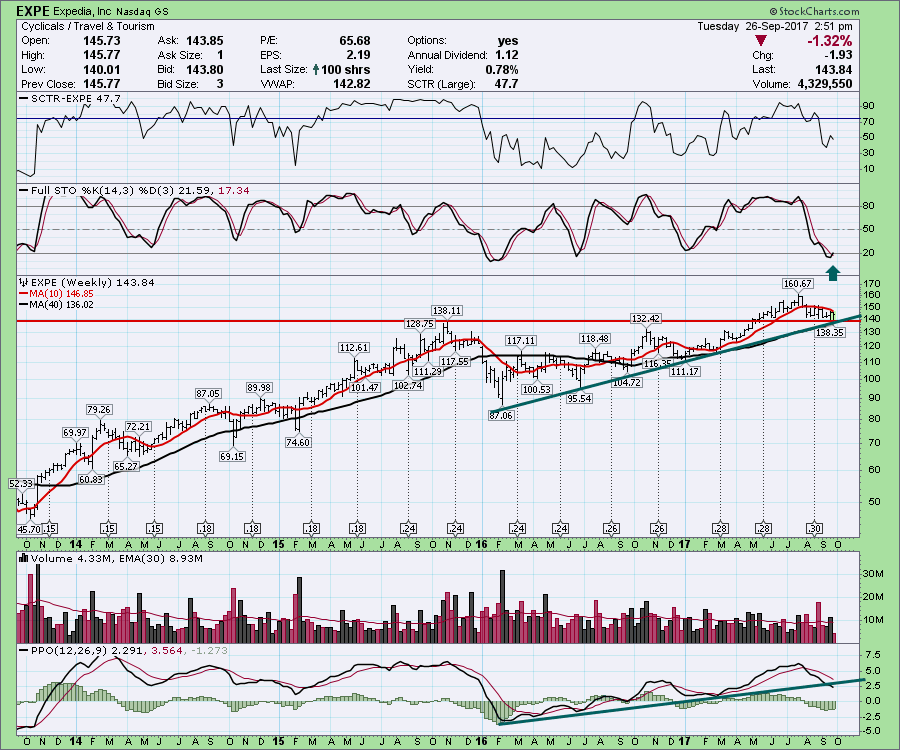
The Expedia (EXPE) chart demonstrates a lot of technical setups here. If the setup works, this could pay for your next holiday! Let's walk through them. First of all, the SCTR is a little weaker than I would like and needs to hold 50. The early half of 2016 has an SCTR below 50... Read More
Don't Ignore This Chart! September 25, 2017 at 10:20 AM
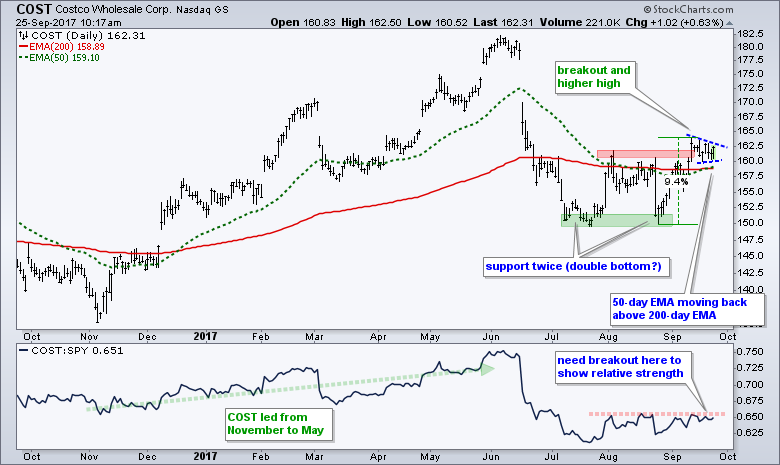
Costco (COST) fell on hard times this summer with a plunge from the low 180s to the 150 area. Despite this gap and sharp decline, the stock firmed in July-August and surged above the red resistance zone in September... Read More
Don't Ignore This Chart! September 24, 2017 at 08:45 AM

Tesla (TSLA) remains a crowd favorite as the stock's 2017 advance has been accompanied by extremely heavy volume. I see major accumulation when I look at TSLA's chart... Read More
Don't Ignore This Chart! September 22, 2017 at 12:17 PM
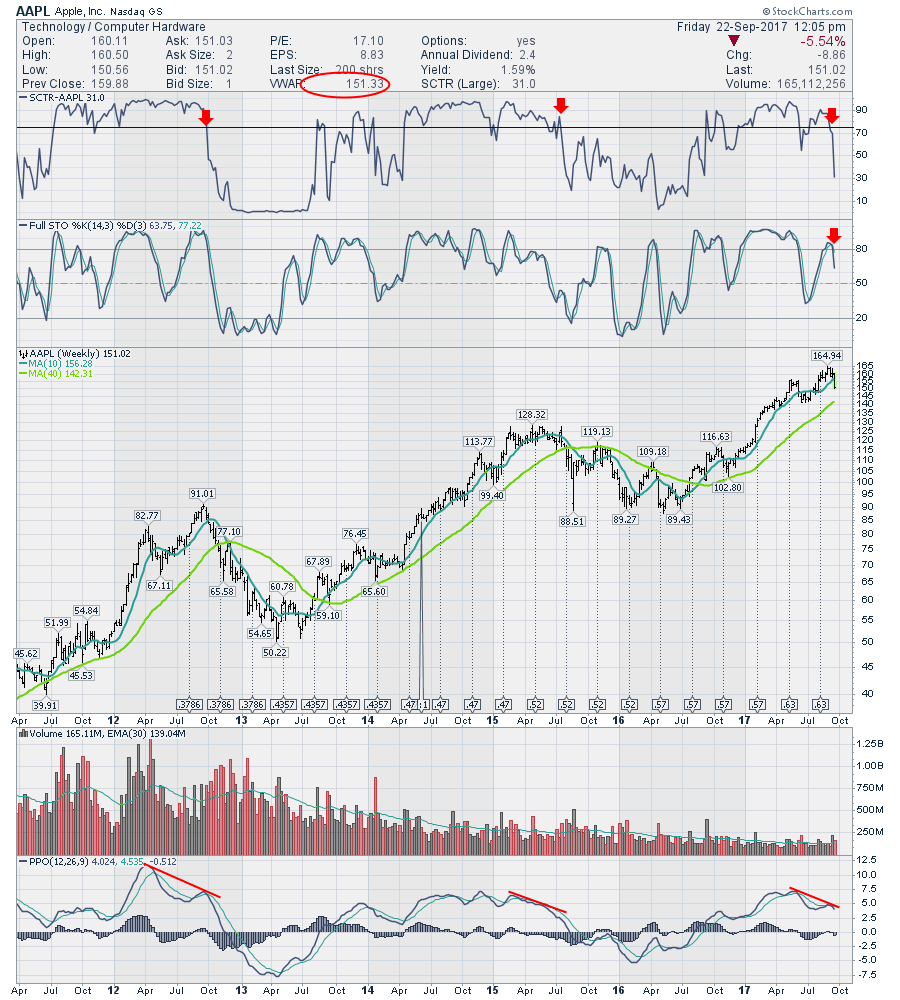
Apple (APPL) long loved and always watched for exciting products came out with a new suite of products last week. With their ability to garner a lot of free advertising in the media discussing the new products, Apple usually generates a tidal wave of sales... Read More
Don't Ignore This Chart! September 21, 2017 at 09:45 AM
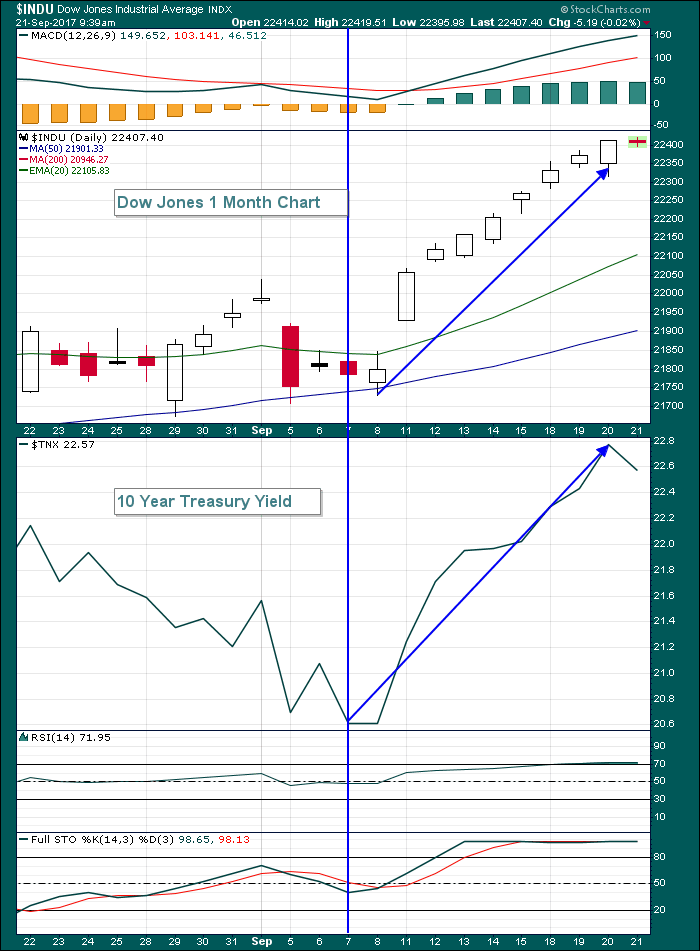
Fed Chair Janet Yellen suggested there'd be another interest rate hike in 2017 and the Fed's overall tone was a bit more hawkish than was anticipated by Wall Street. That resulted in a big spike in the 10 year treasury yield at 2pm EST yesterday, the time of the Fed announcement... Read More
Don't Ignore This Chart! September 20, 2017 at 09:20 AM
This is my third straight DITC posting with a semiconductor stock. The first featured Texas Instruments forming a cup-with-handle pattern and the second featured Intel with a surge towards long-term resistance... Read More
Don't Ignore This Chart! September 19, 2017 at 11:20 AM
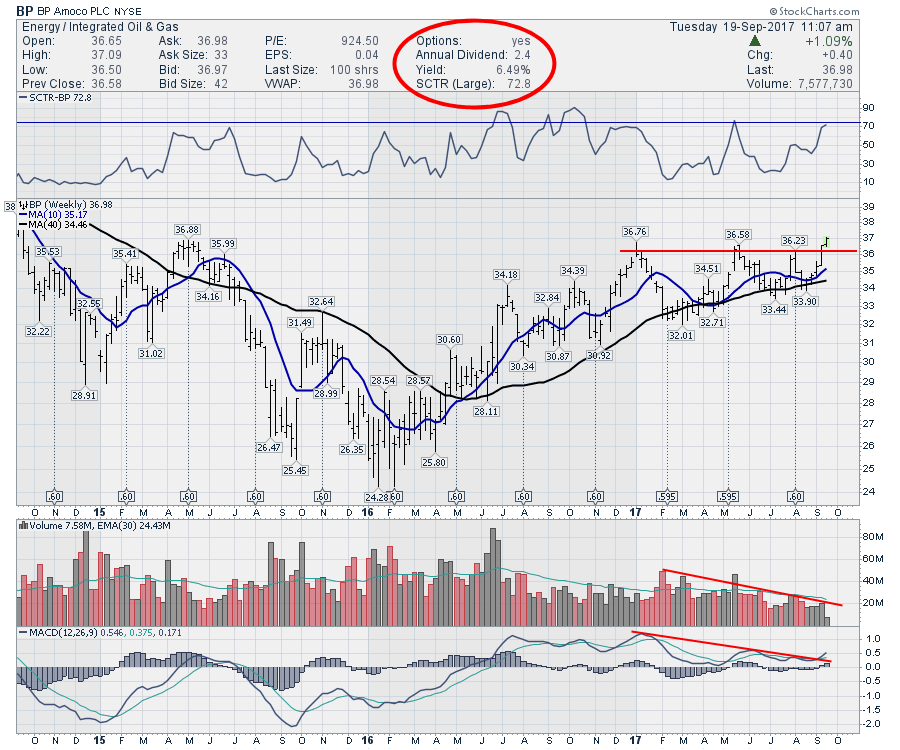
British Petroleum (BP) has been wobbling higher while oil has had a series of lower highs over the course of 2017. This week, BP has pushed to new two year highs. With an astounding dividend yield of 6% and superb price action on the stock, this chart looks great... Read More
Don't Ignore This Chart! September 18, 2017 at 09:36 AM
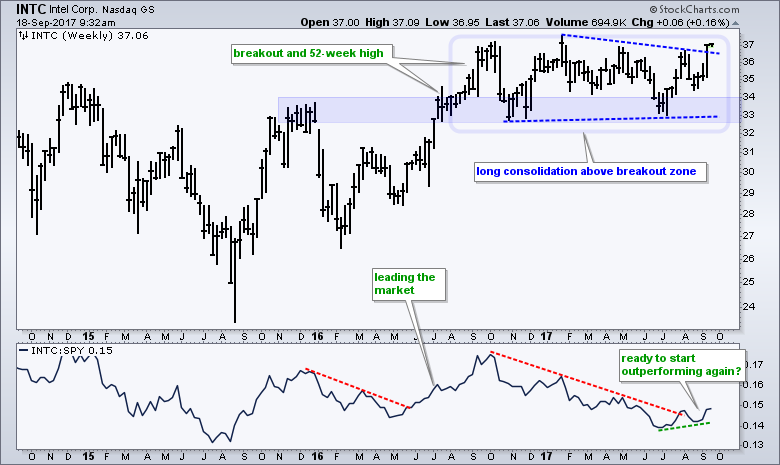
Some sixty stocks in the S&P 500 were up 5% or more last week, and Intel was one of them... Read More
Don't Ignore This Chart! September 15, 2017 at 12:11 PM
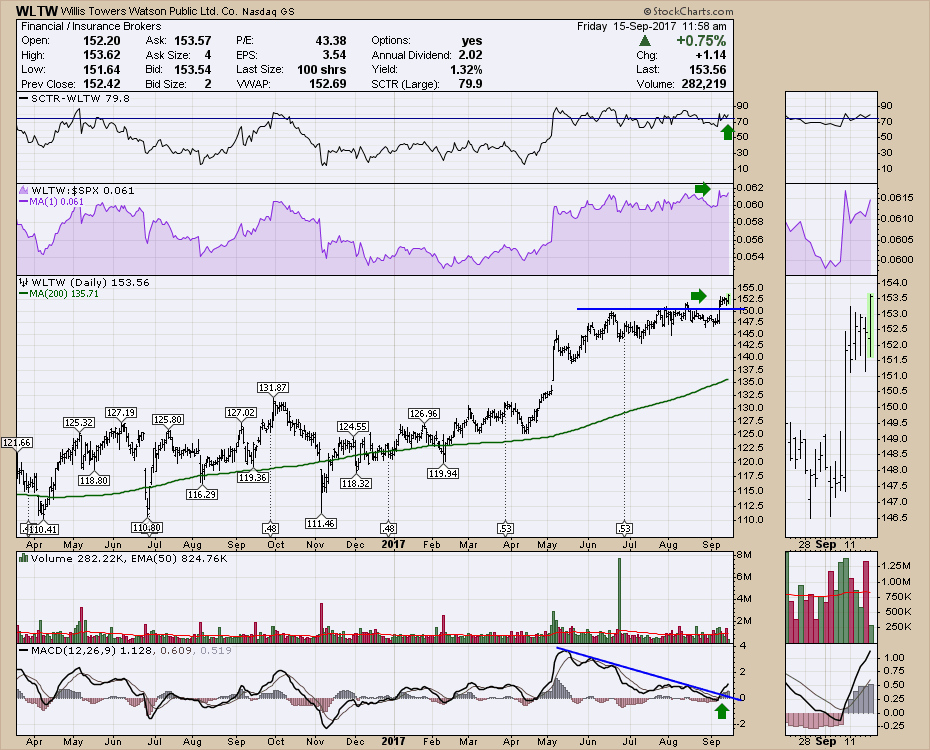
Willis Towers Watson (WLTW) Risk Management company is breaking out to new highs this week. In the face of Hurricanes Harvey and Irma, the stock is surging. It surged above a three month consolidation last week and today it continues to move higher... Read More
Don't Ignore This Chart! September 14, 2017 at 07:31 PM

Sometimes the best moves higher occur after an extended period of sideways price action, or basing. We recently saw a breakout in biotechs ($DJUSBT) and that industry quickly became one of the strongest. The healthcare sector (XLV) also has been among the strongest sectors... Read More
Don't Ignore This Chart! September 13, 2017 at 10:29 AM
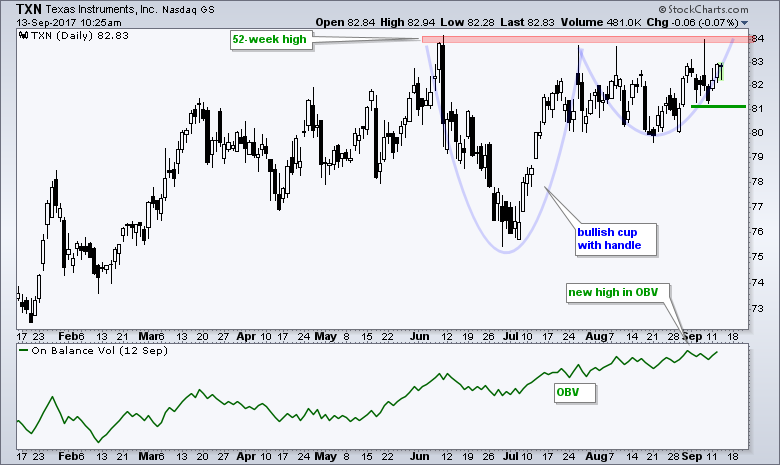
Texas Instruments (TXN), the semiconductor behemoth, formed a bullish cup-with-handle pattern and a classic volume-based indicator points to a breakout. The chart shows TXN hitting resistance in the 83-84 area from June to September (red zone)... Read More
Don't Ignore This Chart! September 12, 2017 at 08:11 PM
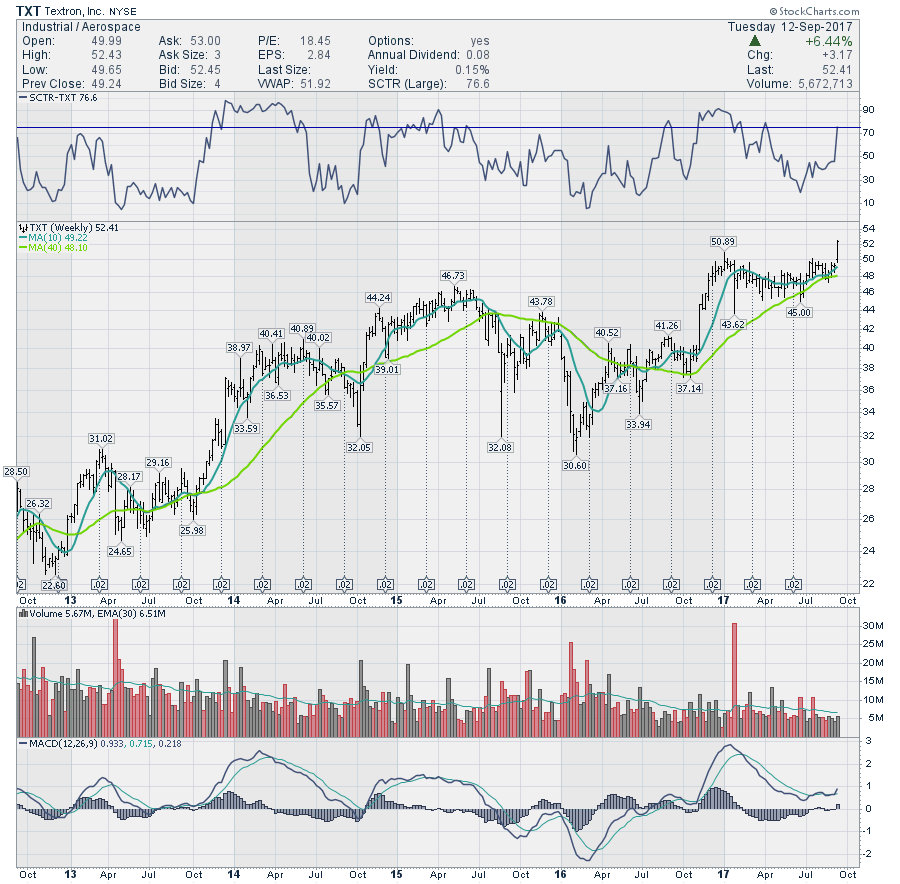
Textron has had a tumultuous last couple of years. The stock has been rallying out of a deep base. It has spent 2017 consolidating, but this week the stock accelerated to new highs. The SCTR is surging up to 75... Read More
Don't Ignore This Chart! September 11, 2017 at 02:35 PM
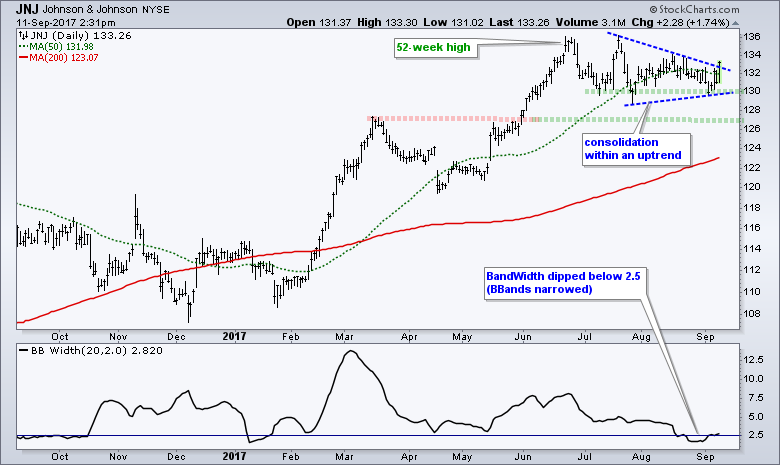
Johnson & Johnson (JNJ) appears to be ending its consolidation period with a surge and triangle breakout over the last three days. Overall, the stock is in a long-term uptrend because it hit a 52-week high in June and remains well above the rising 200-day moving average... Read More
Don't Ignore This Chart! September 08, 2017 at 12:42 PM
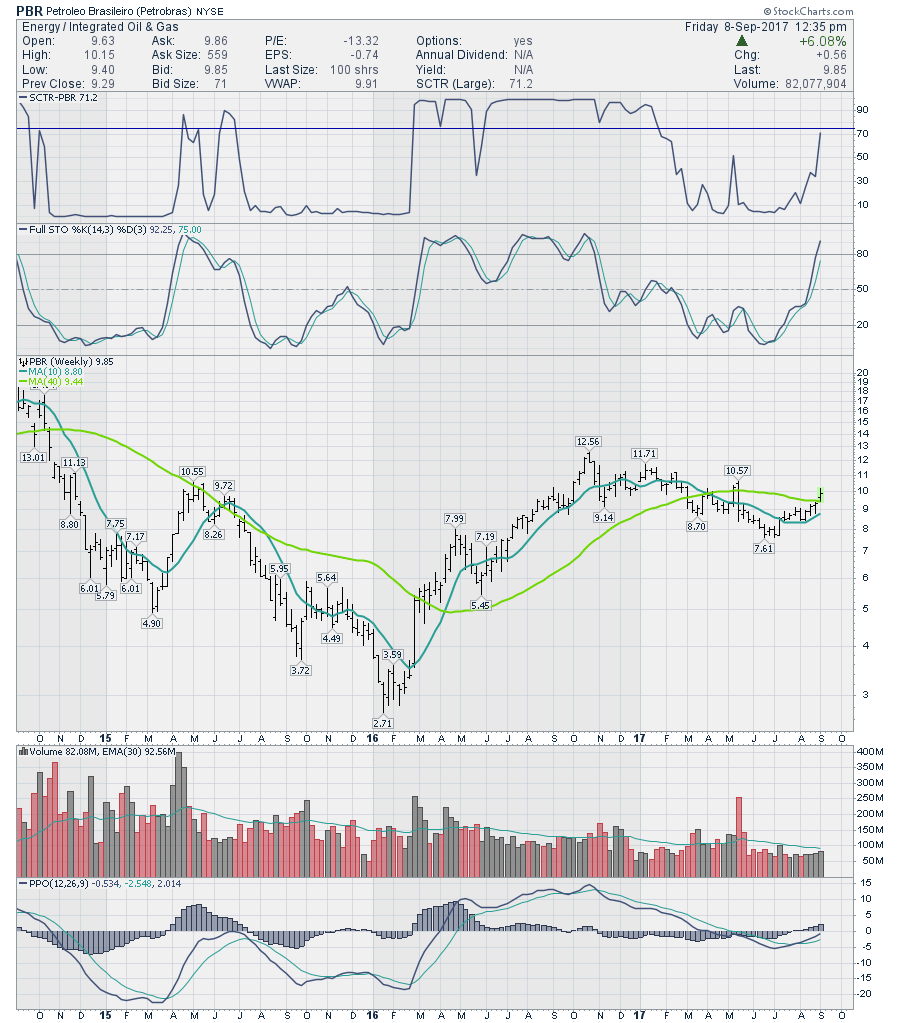
With everyone jumping on the emerging market trade, Brazil has recently shot up to new 9-year highs on the local market chart. Petrobras (PBR), one of the biggest energy companies operating in Brazil is making a moving now too. It is taking out the 40 Week Moving Average... Read More
Don't Ignore This Chart! September 07, 2017 at 06:23 PM
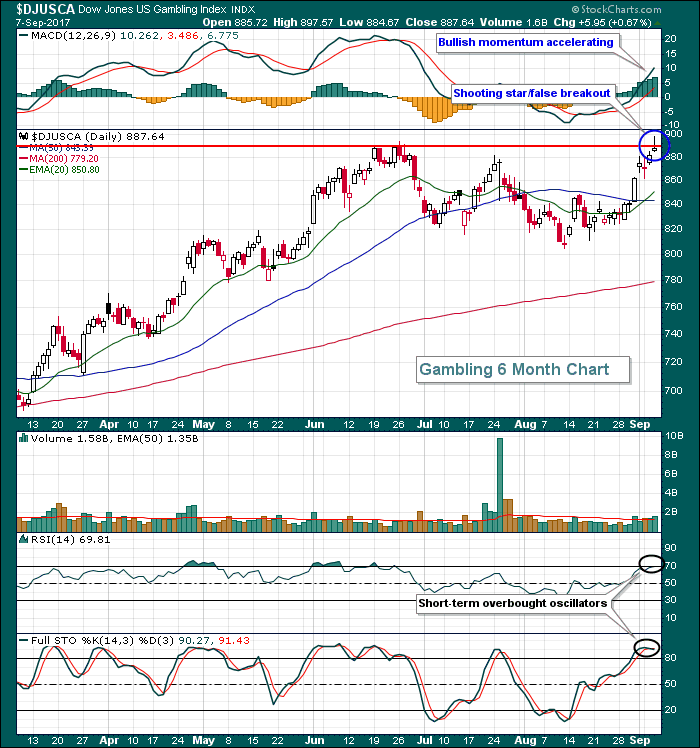
Over the past six months, the Dow Jones U.S. Gambling Index ($DJUSCA) has gained 27.35% to lead all consumer discretionary groups. In fact, renewable energy ($DWCREE) is the only industry group among all sectors to outperform gambling stocks... Read More
Don't Ignore This Chart! September 06, 2017 at 12:08 PM
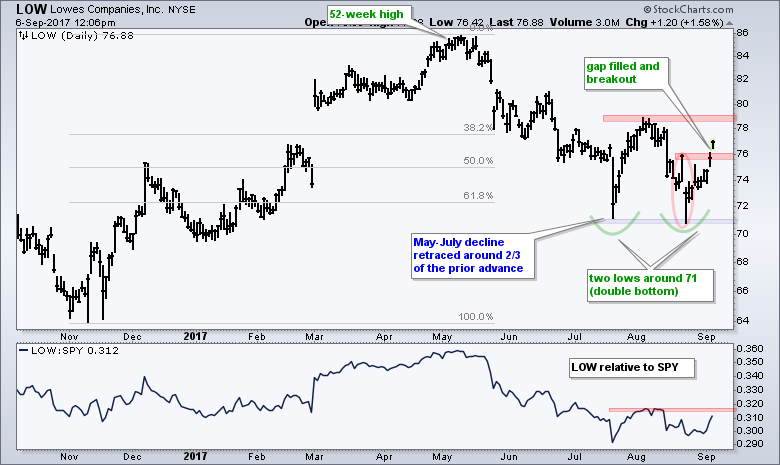
Lowes (LOW) successfully tested the 71 area twice in July-August and surged above short-term resistance this week... Read More
Don't Ignore This Chart! September 05, 2017 at 07:38 PM
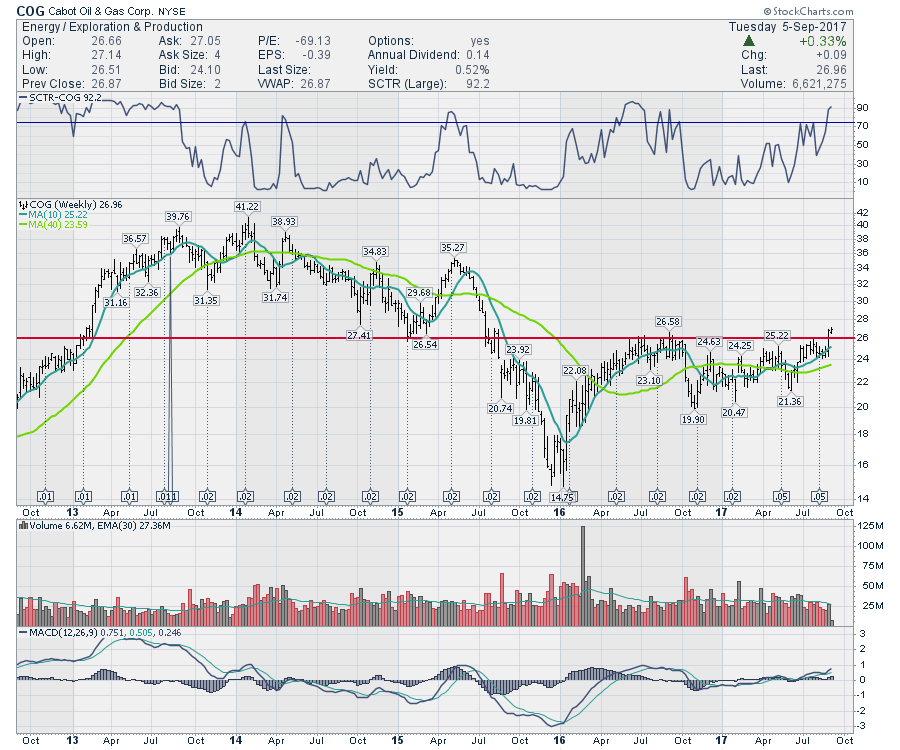
Cabot Oil and Gas (COG) is not just another cog in the oil-patch wheel. This peppy producer just broke out to two year highs, contrary to all the naysayers who keep looking back at the performance charts for energy... Read More
Don't Ignore This Chart! September 01, 2017 at 09:54 AM
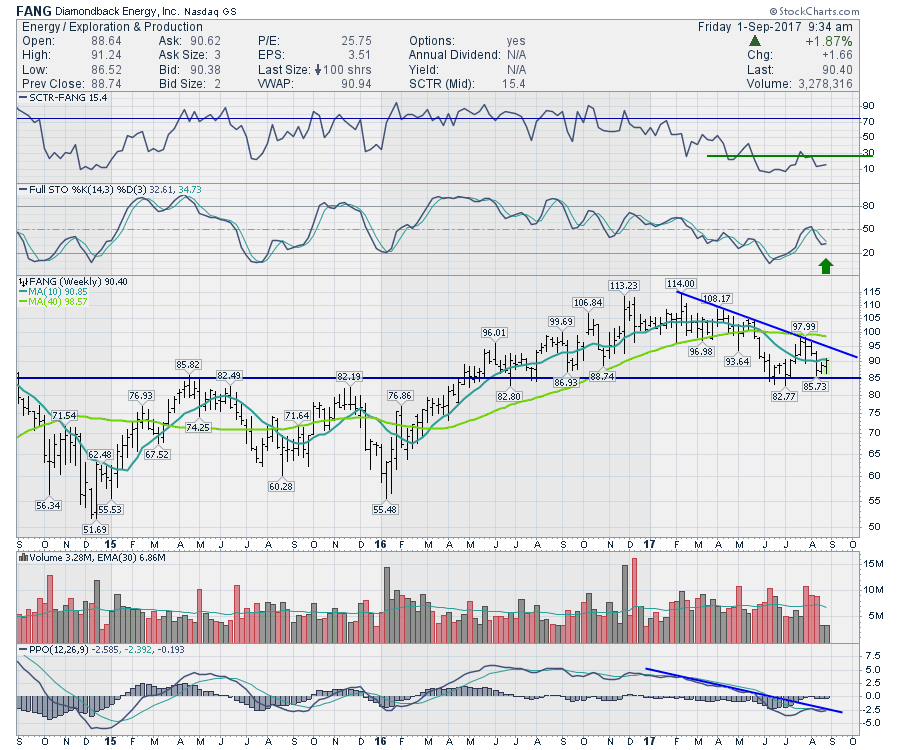
Energy is the most beaten down sector. The SCTR is hanging out at 3.8 and 75 is a good score. It couldn't get uglier? Who knows, but there are a ton of positive divergences setting up on the energy related charts right now... Read More