Costco (COST) fell on hard times this summer with a plunge from the low 180s to the 150 area. Despite this gap and sharp decline, the stock firmed in July-August and surged above the red resistance zone in September. Notice that the stock found support in the 150 area with two bounces and this could be considered a double bottom (green zone). The intermittent highs mark a resistance zone in the 161-162 area and the stock broke this zone in mid September. Technically, there is a higher high and a double bottom breakout is in the making.
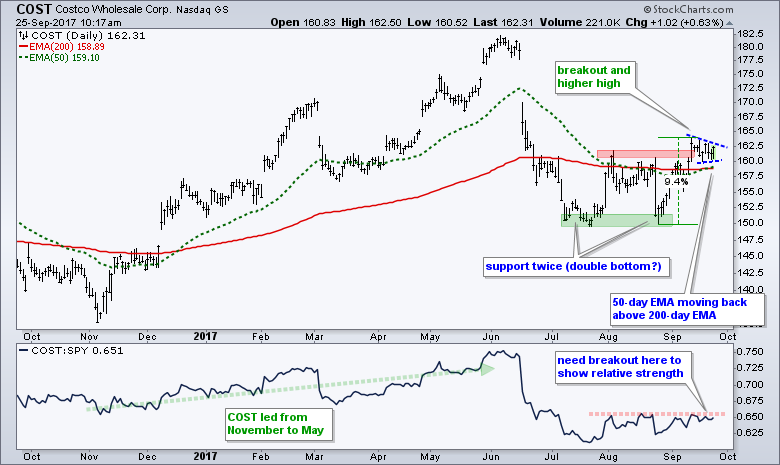
COST was a bit overbought after a 9% surge from late August to mid September. It looks like the stock is working off this condition with a pennant formation. These are continuation patterns and a breakout at 163 would signal a continuation of the prior surge. Another 9% move would target further strength to the 174-175 area.
Follow me on Twitter @arthurhill - Keep up with my 140 character commentaries.
****************************************
Thanks for tuning in and have a good day!
--Arthur Hill CMT
Plan your Trade and Trade your Plan
*****************************************
